Dedicated to the bright memory of my daughter Anastasia
In December of 1998, there was published a seminal work using precise measure-ments of supernovae magnitudes and leading to the conclusion of an apparent accel-erated expansion of observed part of Universe. But when we approach the processing of these precise data from a classical ethereal position, without relativistic ad-justments, we get another picture, and we believe it is the correct one. It is presented in this paper.
|
|
And so, cosmology has gained the real status of a respectable science. It already has splendid results, forming hard foundation, which will remain forever. Theory of "Big Bang" has such a status. |
Ya. B. Zeldovich
There is nothing eternal, alas, except eternity.
Paul Fort
In December of 1998 a seminal work using precise measurements of supernovae magnitudes was published by S. Perlmutter et al. [1] This work was elaborated within the framework of the "Supernova Cosmology Project" by using data of the "Calan/Tololo Supernova Survey".
Its main cosmological conclusion consisted of an apparent accelerated expansion of observed part of Universe. This conclusion is noteworthy because it disagrees with each of three variants of the reigning Einstein-Freedman Universe Model1
The present author has used supernovae data from [1] without relativistic adjustments, and taken as a basis the classical idea that there exists of universally present substance - ether - that is the carrier of EM-field waves, and that subjects such waves to constant fading, just like waves in the usual isotropic physical media: solids, liquids, gases.
In this case, energy of quanta EM-radiation will follow a function of time (see a good review of this approach in [2]):
|
hν = hνo e -Ht |
(1) |
Here h is Planck's constant,
νo is the original quantum frequency,
ν is the quantum frequency after time t,
H is the Hubble constant (the factor of ether absorption),
t is time between emission and reception.
The definition of redshift parameter z is:
|
z = λ / λ 0 - 1 = ν0 / ν - 1 , |
(2) |
where λ is the wavelength of received light,
λ0 is the wavelength radiated,
ν is frequency of received light,
ν0 is frequency of the radiated light.
From (1) and (2) we get dependency of t upon z:
|
t = ln(z+1) / H , |
(3) |
In these terms it is possible to calculate normalized peak power of supernova radiation:
W = t2 2.512 M1 – m x peak ,
where t is time [ 109 years],
2.512 is the base of star luminosity scale,
M1 is the
supernova luminosity, extrapolated to 109 light years,
mx peak is the observed supernova peak luminosity.
This Author reviewed data [1] and found pinpoint accuracy for its correspondence to Eq. (1). Average absolute Type Ia supernovae luminosity is determined by
M0 aver = M1 – 2.5 lg(108/3.263)2 = -18.5
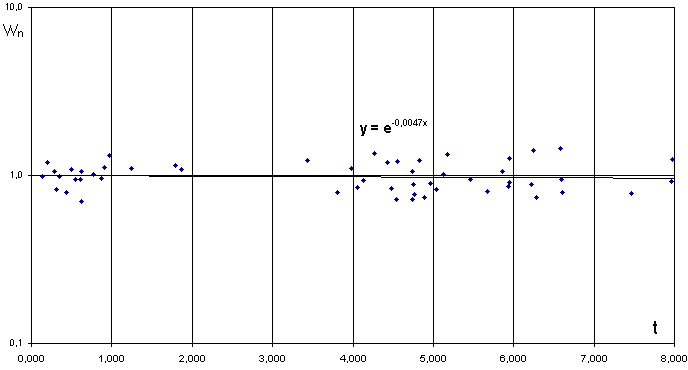
The supernovae distribution on time scale (3) using sample [1] is shown on Fig. 1. (For source data, see
table 1.)To reduce data dispersion for small z, a correction for the velocity of the observer with respect to the Cosmic Microwave Background is made. This velocity is taken as 390 km/s or 0.0013 of the light velocity2.

Fig.1. Distribution of 52
supernovae on non-relativistic time scale [106 years]
for H = 72 km/sMps (fading of light already substracted from data).
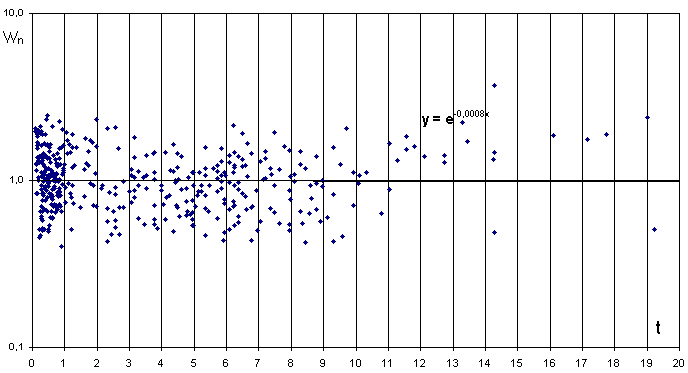
For more exact checking Eq. (1) data on Type Ia supernovae from 1973 to 2003 were examined [2]. If value of M0 were differed from earlier received average M0 by no more than on 0.8 luminosity unit, it was encluded to further processing. If the redshift of supernova were not indicated, it was restored from "relativistic (Doppler effect) velocity".
As a result, the distribution shown on figure 2 was constructed (For source data, see table 2).

Fig.2. Distribution of 433
supernovae on non-relativistic time scale [109 years]
for H = 72 km/sMps (fading of light already substracted from data).
Unlike data in [1], catalogue data are not so precise, and the dispersion of their distribution is higher. However estimate of average M0 differs from that of the first sample by only -0.182.
The correctness of statistics of the sample used is seen from the histogram, shown on Fig. 3.
From the results of this data processing, it was determined that most ancient supernova 1995bf (Gal-Yam, Sharon, Maoz) has the age 25.9 109 years. That is to say, its age is nearly two times more, than the presumed age of "relativistic" Universe (This supernova is unique in its remoteness, which is not clearly revealed by relationships on Fig. 2.)
Histograms of supernovae distribution on time and supernovae normalized frequency by volume within observed part of Universe are shown on Fig. 4.
|
|
|
The distribution of supernovae frequency shows that 6-7 109 years ago, intensity of supernovae origin decreased exponentially. So in our galaxy and nearby galaxies, the intensities of supernovae origin are lower than observed in distant cosmos.
Conclusions
From this study, we can draw following conclusions:
With the exponential increase the wavelength of light and the presence of ether with 2.73 0K temperature (Cosmic Microwave Background, CMB) different celestial bodies have their own horizon of visibility:
R = c ln(T/T0) / H ,
where c is velocity of light in vacuum,
T is temperature of the radiation of the observed
celestial body,
H is Hubble constant, 72 [km / s Mps]
T0 is the
temperature of ether, 2.73 0K.
So, for stars having 6000 0K surface temperature, this horizon has following value:
R = 13.6 ln(6000/2.73) = 105 [109 years]
According to this formula, the CMB is formed "locally"; that is to say, not hereinafter plus or minus 500 megaparsec. This conclusion has confirmed the recent studies of correlations of x-ray sources with Cosmic Microwave Background [4].
Being proportional to the logarithm of frequency, the horizon for high-energy quanta, such as those in x-rays and gamma-rays, must be greatly enlarged.
The model offered does not need in hypothesis of Big Bang and "expansion" of the Universe. It does not require a relativistic Doppler effect, the absence of which in the Solar system was shown 40 years ago, in 1961 during radar measurements of Venus surface [5,6].
In the model offered, there is no conflict between the age of the Universe and the age of ancient formations in the in the cosmos.
In the model offered, there is no "photometric paradox", since EM-radiation is absorbed by the ether - i. e. by the "physical vacuum". However, some mechanism for ultimate disposal of ether energy is necessary to preserve a stable temperature 2.73 0K. Possibly, it is a process of spontaneous birth of elementary particles within localities of increased temperature in the ether [7].
Since Eq. (1) and its correspondence to the distribution of supernovae are invariant for any value of Hubble constant, known at present time only approximately, it will remain equally valid after any future revision of the cosmic distance scale.
Acknowledgment
The author thanks Valery V. Petrov for his corrections, which have improved this presentation.
The author thanks Dr. Cynthia Kolb Whitney and Daniel Whitney for important help with English version of this article.
1 Three types of Einstein-Freedman's Model are options with Ω <1 (eternally expanding Universe), Ω =1 (expanding to stationary) and Ω >1 (expanding, then shrinking). Ω is normalized density of Universe.
2 390+30 km/s velocity is average value of different authors measurement of absolute Earth's motion in the ether. Besides Cosmic Microwave Background anisotropy, which Space-oriented frequency changing corresponds to that velocity, there are measurements of light group velocity changing made by D.G. Torr and P. Kolen [Natl. Bur. Stand. (U.S.), Spec. Publ. 617, 1984], prof. St. Marinov [Austria, 1987] and others.
References:
Karim Khaidarov
Borovoye, August 1, 2003.