Reprint from
Swinging Sun, 79-Year Cycle, and Climatic Change
**by T. Landscheidt*
* Dr. Theodor Landscheidt, Federal Republic of Germany.
** Affiliated with the Space Environment Services Center, Boulder, Colorado, U.S.A., in preparing long range solar activity forecasts.
Paper presented at the 9th International Interdisciplinary Cycle Research Symposium, Trier, Fed. Rep. of Germany, 6-11 July 1980.
Abstracting keywords: Climatic change — 80-year cycle — forecast of solar activity — grand minima in sunspot activity — Little Ice Age— Maunder Minimum— solar terrestrial relations— sun's oscillations about center of mass.
ABSTRACT
The secular cycle of solar activity is related to the sun's oscillatory motion about the center of mass of the solar system. Comparatively short periods of revolution with relatively high rates of curvature constitute a potential for crucial values of the time integral of torque AL = J t0 r (t) dt which seem to give rise to a weak but long lasting flow of solar plasma that modulates short-term flow due to the dynamo effect. Relatively strong impulses of the torque A L occur at mean intervals of 19.86 years. Four consecutive impulses respectively define a permanent wave with a quasiperiod of 79.46 years which determines the distribution of positive and negative extrema in activity. Phases of 0° or 90° indicate a potential for peaks and phases of 180° or 270° can lead to troughs. Such potentials are actually released if A L transgresses a definite threshold value. The ensuing interval variations in the secular cycle are verified by records of sunspots and aurorae dating back to the 4th century AD. Rare activity-deficient periods like the Maunder Minimum, which according to Eddy et al. are related to changes in the Earth's climate, solely occur when AL reaches exceptional values meeting a special criterion. This is confirmed by radiocarbon data going back to the 6th millenimum BC. The next minimum in the 79-year cycle will occur in 1990. It will be more pronounced than the minimum in 1811.
INTRODUCTION
Eddy (1976, 1977) has focused attention on periods of exceptionally weak solar activity like the Maunder Minimum (1645 to 1715) and the Spoerer Minimum (1460 to 1550). These grand minima, confirmed by carbon 14- data, seem to be related to long-term changes in world climate. Their influence on solar-terrestrial phenomena is obvious. In addition, they furnish new evidence of long-duration variations in solar activity. According to Gleissberg (1975) the discovery of corresponding long-term recurrence tendencies in sunspot frequency would be of considerable importance, for it would make possible accurate long-range forecasts of low-frequency variations.
The Maunder Minimum and the Spoerer Minimum coincide with troughs in the 80-yr cycle of sunspot activity (80 YC) which according to Gleissberg (1975) and Hartmann (1972) occurred about 1500 and 1670. Moreover, the two grand minima in question are separated by an interval which is near the 179-yr period of variation in the sun's oscillatory motion about the center of mass of the solar system (Jose, 1965). These relations are indicative of a common background phenomenon capable to generate cyclic variations. Considering the long range of these variations, it seems plausible to assume that it is the sun's swing about the center of mass (CM) which causes long-term cycles in solar activity while short-term variations are due to the sun's differential rotation on its axis (Parker, 1955; Leighton, 1969; Stix, 1974).
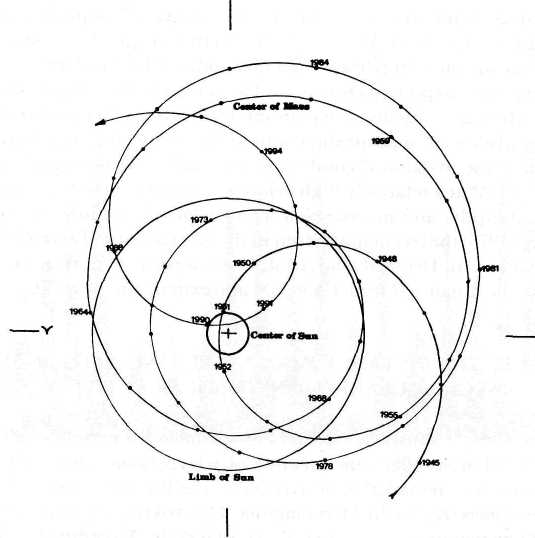
The swinging sun forms heteromorphous oscillations indicative of interesting rates of dynamical change. In relation to the galactic center only CM follows an elliptic path, whereas the sun describes a very irregular helix around the elliptic line of motion of CM. This can be seen from Fig. 1 which shows the ecliptical positions of CM relative to the center of the sun (CS) for the years 1945 to 1995. The heliocentric representation and the line marking the limb of sun make it easy to see whether CM is to be found above or below the sun's surface and allow to judge the distance from CS to CM which varies from 0.01 to 2.19 solar radii. One revolution of the sun arround CM is completed within 9 to 14 yr.
When a vessel containing a fluid is subject to oscillations, currents will arise in the fluid (Parlenko, 1933). Hydrodynamics and magnetohydrodynamics follow analogic laws. Plasma exposed to centrifugal forces shows convection. It is very sensitive to kinetic and magnetohydrodynamic instabilities even if it
Fig. 1. Ecliptic positions of the center of mass of the solar system (CM) relative to the sun's center (CS) for the years 1945 to 1995.
shows a toroidal structure. Thus the sun might be considered as a cosmic vessel containing plasma exposed to heteromorphous oscillations giving rise to large-scale currents in the plasma. Such relatively weak but long-lasting flow could supersede or modulate short-term plasma currents caused by the sun's differential rotation. It should be noted that the ratio of the duration of the shortest revolution of the sun around CM and a rotation on the sun's axis is about 129:1. The flow-generating effect should be strongest during revolutions of short duration developing relatively high rates of curvature K. Especially high /C-values could be expected when the restoring force in the sun's respective swing about CM reaches a maximum. This occurs when the sun's displacement relative to the equilibrium position of the oscillating system becomes greatest. Calculations show that the sun is in its equilibrium position when its center runs at a distance of 2.19 solar radii from CM. Therefore the restoring force reaches maximum values when CS and CM come to a minimum in their distance. As the sun's oscillations are driven by the torque r — dL/dt, the strength of impulses of the torque A L should be an appropriate measure of the effect in question. A L is also called time integral of torque because of the relation A L = /(0 r (t) dt. Wood (1975) holds that torque effects on the oblate spinning sun are more important than tides induced by the planets.
If this working hypothesis is in accord with reality, distinct effects are to be expected when A L reaches a maximum, especially if there are consecutive strong impulses with opposite directions of the torque. It can be derived from Fig. 1 that these dynamical conditions were fulfilled about 1951 when CS approached CM at a relatively high velocity, came very near to it, changed its direction abruptly, and moved away again relatively rapidly. According to Gleissberg (1976) the recent maximum in the 80 YC occurred about 1950. This is no fortuitous fit. Detailed analysis discloses a permanent relation between minima in the distance R from CS to CM and extrema in the 80 YC.
MINIMA IN THE DISTANCE R CONSTITUTING A POTENTIAL OF SECULAR VARIATIONS IN SOLAR ACTIVITY
Reliable means of sunspot numbers are available for cycles 1 - 20 of solar activity (Waldmeier, 1961), the maxima of which range from 1761 to 1968. Fig. 2 shows the remarkable differences in the highest smoothed monthly sunspot numbers (RM) of the 11-yr maxima. The striking sequence of groups of high and low maxima is indicative of a secular cycle. According to Gleissberg (1952), Cole (1973), and Hartmann (1971) the duration of the cycle is 80 years. This has been confirmed by dendrochronologic data (Maximov, 1953) and varve analyses (Anderson and Koopmanns, (1963).
From 1750 to 1970, oscillatory phases meeting similar dynamical conditions to that in 1951 occurred in 1772, 181lfanu'l891. In Fig. 2 the corresponding epochs are marked by arrows. They are synchronous with the groups of high and low 11-yr maxima. According to Gleissberg (1957) the respective epochs in the 80 YC fall on the years 1775, 1810, 1855, and 1900. In 1772, 1811, 1850, and 1951 CS reached very short distances to CM; the respective values are 8-10 AU, 3 • 10"4AU, 4 • 10"4AU, and 4 • 10"4AU. Between 1850 and 1951 the two centers came closest in 1891, but the approach was less close than in the other four distance minima; the shortest distance was at 16 • 10 AU. Further analysis shows that the closeness of approach in a distance minimum is only an indication of a strong oscillatory impulse. As will be shown, the values of AL near a distance minimum of CS and CM constitute a sharper criterion of strong effects on long-term variations.
Fig. 3 presents a plot of the distance R from CS to CM versus time for the 179-yr period 1811 to 1990. R-plots for the preceding and the following 179 yr period show a striking similarity in the pattern of the variation with time, as Jose (1965) has pointed out already. But after an interval of time which is long compared with the 179-yr period, variations in the R-curves must be expected due to the slow changes in the structural elements of the solar system. An inquiry covering the 179-yr periods back to the sixth millenium BC yields variations only in the closeness of approach of the two centers while the loci in the R-curves where distance minima occur do not shift. They form a permanent pattern such that the loci of distance minima indicated in Fig. 3 by arrows are also representative of the loci in following or preceding 179-yr periods. According to the results of an investigation going back to the 6th millenium BC, the loci of the minima 1826 and 1966, marked by dashed arrows, are not relevant to the relations in question. The dynamic conditions are such that the impulse of the torque is too weak near these loci. The remaining nine loci of distance minima DM possess sufficient potential as to the strength of the impulse of the torque.
Fig. 3. Change in the distance R from CS to CM for the 179-yr period 1811 to 1990. The solid arrows point to distance minima DM constituting a permanent interval pattern recurring in preceding or following 179-yr periods. Inherent in the loci of DM is a sufficient potential of strong impulses of the torque. The vertical dashed lines indicate initial phases in the 79-yr cycle.
INTENSITY OF SOLAR VARIATIONS MEASURED BY THE TIME INTEGRAL OF TORQUE OF THE SUN'S MOTION
The actual realization of the potential inherent in DM depends on the special dynamic conditions in the individual case. Quantitative criteria defining threshold values for flow generating effects cannot be derived from the theory of solar activity as it is not elaborated enough to allow such conclusions. Observation of the sun under natural conditions in the laboratory solar system yields the following criteria: About 7 to 10 years before DM the torque becomes equal to zero. The increasing negative torque gives rise to an impulse the strength of which must transgress a threshold value which is defined by the time integral of torque/0 — t (t) dt. The lower limit of integration t0 coincides with the time at which t is equal to zero. tx = 300 days after t0. It is an essential condition of effects that
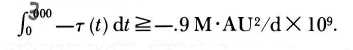
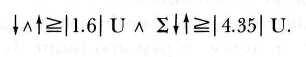
Near DM t becomes equal to zero again. The torque is subject to a relatively abrupt change in direction. The impulse induced by the increasing positive torque must also transgress the threshold value defined already, which gets a positive sign. The respective negative and positive time integrals of torque are represented by the symbols \ and T. Henceforth, U is written for the unit M • AU2/dX 109. A
further essential condition of strong effects is Ј{f i12.21. The complete expression defining the criterion Cnl for relevant distance minima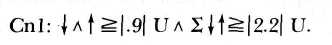
All of the five dates appearing in Fig. 2 fit this RDM-criterion.
The values are:
RDM 1772: | = — 1.29 U; t = 2.08 U; 2 It = |3.37| U
RDM 1811: | =—1.80 U; t = 2.27 U; 2 it = |4.07| U
RDM 1850: |=— 2.77 U; t = 1.60 U; 2 it = |4.37| U
RDM 1891: |=—1.79 U; t = 1.41 U; 2 It =|3.20| U
RDM1951: |=—1.17U; t=2.38U;2lt=|3.55| U.
All other DM in the interval 1750 to 1970 do not meet the criterion. As can be judged by the 7?-plot in Fig 3, DM 1912 has a relatively high potential compared with DM 1835, DM 1873, and DM 1929. But DM 1912 also does not fulfill the RDM-criterion: DM 1912:1=— .63U;t = 1.07U; 2|t = |l.70| U.
RELEVANT PHASES OF A PERMANT CYCLE OF 79.46 YEARS IN RELATION TO OBSERVATION
An investigation covering data going back to the 6th millenium BC yields that DM with sufficient potential for strong impulses of the torque are spaced such that their mean interval is equal to 19.86 yr. This is twice the period of 9.90 respectively 9.96 yr that Cohen and Lintz (1974) and Wittmann (1978) have found by means of maximum entropy power spectra of the yearly mean spot number. This period is not a negligible harmonic. A histogram elaborated by Eddy (1977a) showing the distribution of periods between maxima in the 11-yr cycle AD 1700 to present is far from Gaussian. The weightiest partial center of gravity does not coincide with the 11.1-yr average period, but with the period of about 10 yr.
It is a further result of inquiries covering more than 7000 years before 1950 (BP) that four mean intervals of 19.86 yr assigned to the respective DM form a cycle the average duration of which is equal to 79.46 yr (79 YC). The standard deviation a = 2.59. The wave which seems to carry the 79 YC settles whether a RDM-event releases a maximum or a minimum in the secular cycle. The current cycle began in 1929.6. The initial phase of the foregoing cycle fell on 1850.8. This is indicated by dashed vertical lines in Fig. 3. Table 1 gives the consecutive initial phases E ranging from 5300.3 BC to 2248.6 AD. Approximate epochs for any time can be derived from the formula E = 22.9 + (79.46*(±N)). ±N stands for the number of cycles counted separately AD and BC.
The respective DM define the main phases of 0°, 90°, 180° and 270° in the wave. They constitute the cornerstones of the wave structure as they fix the nodes and the amplitudes. As is shown in Fig. 3 the DM 1850, 1873, 1891, and 1912 are assigned to 0°, 90°, 180° and 270° respectively, while DM 1951 defines the 90°-phase of the current cycle etc. The 79 YC wave shows permanent polarities. It is positive as far as the phase angle 6 < 180° and becomes negative when 0-^ 180°. On condition that the RDM-criterion is fulfilled, phases of 0° and 90° result in peaks in the 79 YC while phases of 180° and 270° lead to troughs. As will be shown, this is a permanent feature of the 79 YC even discernable in solar variations in the 6th millenium BC. According to celestial-mechanical considerations and random calculations going back more than 20000years, the wave pattern formed by four equidistant DM respectively seems mean interval = 79.46; a = 2.59 to be as stable as the structure of the solar system. Hence it should be allowed to speculate as to the origin of the wave that the polarity was set in an initial phase coinciding with the beginning of the sun's oscillations about CM or the start of solar variations.
Table 1. Initial phases E of the 79-year cycle 5300 BC to AD 2248.
|
—5300.3 |
—3393.1 |
— 1487.2 |
419.5 |
|
—5221.8 |
—3314.0 |
— 1408.2 |
497.7 |
|
—5142.7 |
—3236.7 |
— 1325.5 |
581.7 |
|
—5065.1 |
—3151.6 |
; —1245.0 |
660.6 |
|
—4985.2 |
—3075.8 |
— 1168.2 |
738.3 |
|
—4902.3 |
—2996.4 |
— 1090.5 |
816.1 |
|
—4823.3 |
—2917.3 |
— 1010.3 |
899.3 |
|
—4746.1 |
—2841.9 |
— 927.5 |
979.5 |
|
—4668.9 |
—2755.2 |
— 849.3 |
1056.9 |
|
—4584.2 |
—2678.8 |
- 772.8 |
1134.8 |
|
—4508.8 |
—2599.8 |
— 692.8 |
1215.5 |
|
—4427.2 |
—2521.2 |
— 609.8 |
1298.3 |
|
—4349.3 |
—2443.2 |
— 530.5 |
1375.7 |
|
—4268.5 |
—2359.2 |
— 453.3 |
1453.6 |
|
—4186.4 |
—2280.4 |
— 374.5 |
1532.7 |
|
—4108.5 |
—2202.4 |
— 297.9 |
1616.8 |
|
—4031.8 |
—2125.7 |
— 210.2 |
1694.8 |
|
—3951.2 |
—2042.3 |
— 135.8 |
1772.5 |
|
—3868.8 |
— 1962.9 |
— 55.2 |
1850.8 |
|
—3789.6 |
— 1883.3 |
22.9 |
1929.6 |
|
—3712.4 |
— 1806.4 |
100.5 |
2013.8 |
|
—3633.5 |
— 1726.0 |
184.5 |
2091.2 ; |
|
—3550.7 |
— 1643.4 |
263.5 |
2169.2 |
|
—3470.6 |
— 1564.2 |
341.8 |
2248.6 |
Fig. 4 displays the course of the 79 YC covering DM of the years AD 341 to 2248. The respective phases of 0°, 90°, 180° and 270° are marked by fat dots. Legends are added at the beginning of the wave. Plus and minus signs point to the respective polarities. When the RDM-criterion is fulfilled the corresponding RDM is marked by an arrow. Peaks in the 79 YC assigned to the positive phases 0° and 90° on the right of the wave are represented by arrows pointing upward. Troughs in the 79 YC assigned to the negative phases 180° and 270° on the left are indicated by arrows pointing downward. The relation of these results to observed long-term variations is so obvious that a statistical evaluation would be redundant. The plot in Fig. 5, the author of which is Gleissberg (1958), shows the secularly smoothed invervals DM between consecutive maxima in the 11 YC which also follow the 80 YC. Minima of DM correspond to maxima of the highest smoothed monthly average of sunspot numbers RM and vice versa. Gleissberg'splot covering the years AD 300 to 1950 is based on data published by Schove (1955) which are reliably correlated with /?M at least as to the main features of the 80 YC. In respect of the secular smoothing of the data the remaining deviations and uncertainties cannot have great weight.
Fig. 4. Course of the 79-yr cycle from AD 341 to 2248. Positive phases (0< 180°) and negative phases (6 S 180°) are indicated by positive and negative signs. The main phases 0°, 90°, 180° and 270° coinciding with DM-potentials are represented by fat dots. Arrows pointing up or down symbolize positive or negative RDM which actualize DM-potentials on condition that the time integral of torque criterion Cn! is fulfilled. Upward arrows on the right of the wave indicate peaks, downward arrows on the left mark troughs in the secular cycle of solar variations.
Fig. 5. Secularly smoothed intervals DM between consecutive maxima in the 11-yr cycle contouring the secular variations in solar activity which are synchronous with relevant distance minima RDM meeting the time integral of torque criterion Cnl. Positive and negative RDM, the polarities of which follow the phases of the 79-yr cycle, are represented by arrows pointing up or down respectively.
The arrows in Fig. 5 represent the positive and negative RDM the dates and polarities of which are given in Fig. 4. Few successive RDM showing the same polarity at the short interval of about 20 years like —RDM 458, —RDM 481 or +RDM 816, +RDM 839 were marked at the mean date. The correspondence with peaks and troughs in the Gleissberg data is evident. A sole discrepency appears about 1100. It is interesting in this respect that Wittmann (1978), who based his investigation exclusively on naked eye observation of giant sunspots, found deviations from Schove's data for the years 1060 to 1115. According to Gleissberg (1975) and Hartmann (1972) the duration of the 80 YC since 350 AD, if counted from minimum to minimum, varied from 40 to 120 yr. These variations posed a problem for all attempts to forecast long-term cycles in solar activity. Fig. 4 reflects the variety of observed intervals from peak to trough or trough to peak and from maximum to maximum or minimum to minimum. But these fluctuations within a wide range are explained now by the combination of the permanent 79-yr wave and the irregular distribution of RDM within the respective cycle. The larger interval between the trough about 1890 and the peak about 1950 visible in Figs. 2 and 4 becomes comprehensible. Of special interest is the course of solar activity after the Maunder Minimum. In the 18th century solar activity climbed up to a level lying a step higher than before. This is clearly visible in Fig. 6 presenting a plot elaborated by Gleissberg (1977, 1979).
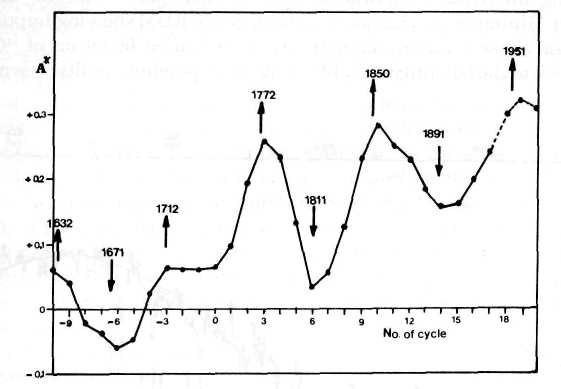
Fig. 6. Peaks and troughs in the Gleissberg cycle of sunspot activity outlined by the secularly smoothed asymmetry A* of the 11-yr cycle. The data for cycles 18-20 are extrapolated. Synchronous positive and negative RDM are marked by arrows indicating the respective polarity. The two successive positive RDM 1712 and 1772 are properly reflected by the horizontal course of the ,4 "-curve after RDM 1712 appearing instead of a minimum in the plot.
It shows the secularly smoothed values of asymmetry A* for the 11-yr cycles —10 to+19covering the maxima 1639 through 1957. The asymmetry A related to the steepness of ascent in the 11 YC is also linked up to the intensity of 11-yr maxima. High positive asymmetry values indicate high sunspot maxima; low positive or negative asymmetry values concur with weak maxima. The RDM 1632 to 1951 represented by arrows indicating the respective polarities fit the A*-curve exactly. Even the upward step in the general level of activity is reflected. It is due to the fact that in 1712 and in 1772 successive positive RDM occurred, the effect of which was not disturbed by an intermittent negative RDM. This can be seen from Fig. 4. The horizontal course of the A *-curve after the positive RDM 1712 is an adequate expression of this relation. If two negative RDM succeed each other at an interval of 40 years or more, the general level of activity is lowered. This occurred several times in the space from 2000 BP to 7000 BP. The depth of the troughs in Fig. 6 is proportional to the respective 2 It -values.
QUANTITATIVE CRITERIA OF GRAND MINIMA IN SOLAR ACTIVITY
If the working hypothesis set up in the introduction is a first step in a promising direction, it should be expected that grand minima like the
Maunder Minimum are characterized by negative RDM showing impulses of the torque of extraordinary strength. An investigation by means of 14C-data going back to the 6th millenium BC yields corresponding results presented in Fig. 7
Fig. 7. HC-deviations since 5300 BC derived from analysis of dated tree rings by Damon, with smoothed curve of sinusoidal variation in the Earth's magnetic moment from Lin et al. The variations modulating the sine curve are attributed to long-term changes in solar activity. The graph after Eddy allows for the vice versa relation of cosmic ray flux with solar activity. Six grand minima (M, Maunder Minimum; S, Spoerer Minimum; G, Greek Minimum; H, Homeric Minimum; E, Egyptian Minimum; S, Sumerian Minimum) coincide with negative RDM meeting the criterion Cn3 which are marked by long arrows. All negative RDM of the category Cn2 which occurred since 5300 BC are represented by shorter arrows. The date of the youngest RDM(Cn2) is 1811.
Changes in the relative abundance of radiocarbon HC in the atmosphere determined from the analysis of dated annual growth rings in trees are reliably related to changes in solar activity (Stuiver, 1961, 1965; Suess, 1968; Damon, 1970, 1977). When the sun is quiet and the solar wind is weak, more 14C is generated by the impact of galactic cosmic rays on the atmosphere, while less HC is produced when the sun is active and the shielding effect of its extended magnetic field against cosmic rays becomes strong. The plot in Fig. 7 based on data given by Lin, Fan, Damon, and Wallick (1975) exhibits the measured 14C-deviations in parts per mil since about 5300 BC, with the smoothed curve of sinusoidal variation in the Earth's magnetic moment, which acts as another shield against cosmic rays. The graph has been replotted by Eddy (1976) with increasing HC in the downward direction to allow for the vice versa relation to increasing solar activity. Eddy (1976) emphasizes in conformity with Damon et al. (1970) that the long-term trends in the radiocarbon content of the atmosphere were regulated in the past 8000 years by the geomagnetic effect, while the shorter term fluctuations superimposed on the sine curve of the Earth's magnetic moment were controlled by changes in solar activity.
Eddy (1976, 1977) has focused attention on the finding that the I4C-record bears the unmistakable signature of grand minima in solar activity. As can be seen from Fig. 7, there occurred only five such minima since 1500 BC. Following Eddy's nomenclature these were the Maunder Minimum (M), the Spoerer Minimum (S), the Greek Minimum (G), the Homeric Minimum (H), and the Egyptian Minimum (E). These epochs are identified in Fig. 7 by the respective abbreviations.
Another S is added for the Sumerian Minimum about 3300 BC. It is conspicuous that the average global 14C-production represented by the smoothed archeomagnetic sine curve in Fig. 7 becomes less sensitive to solar modulation variations at high field intensities and more sensitive at low field intensities. The solar modulation effect increases as the magnetic field decreases (Damon, 1977). Even if this is to be considered in judging the scale of 14C-deviations, the modulation about 3300 BC must be attributed to a grand minimum, especially as it did not occur near the deepest point of the sine curve. This is confirmed by corresponding large scale glacier expansion which only occurred at the time of grand minima (Demon and Karlen, 1973).
All of the six grand minima coincide with special negative RDM meeting a sharpened criterion Cn3:
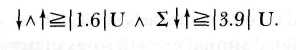
The respective negative RDM in Fig. 7 are marked by shorter arrows. The precise function of this category can easily be judged near the minimum of the sine curve displaying amplified 14C features. The youngest negative RDM(Cn2) occurred in 1811. Its effect can be estimated by means of Figs. 2 and 6. Table 2 presents the Sit -values as to the negative RDM appearing in Fig. 7. It should be noted that since 5300 BC no other negative RDM occurred fulfilling the criteria Cn2 or CN3. Two future events meeting the Cn2 criterion are listed in Table 2 too.
Table 2. RDM g Cn2 since 5300 BC
|
RDM |
(CnS) |
RDM |
(Cn2) |
RDM(Cn2) |
|
|
year |
S|f(U) |
year |
year |
X|t(U) |
|
|
—3275 |
4.38 |
—5181 |
4.00 |
—2778 |
4.25 |
|
— 1448 |
4.68 |
—4863 |
4.05 |
—2459 |
3.90 |
|
— 1269 |
4.74 |
—4388 |
3.90 |
— 951 |
4.113 |
|
— 732 |
4.54 |
—4209 |
4.10 |
— 553 |
4.18 |
|
— 414 |
4.36 |
—3673 |
3.93 |
1811 |
4.07 |
|
— 234 |
4.94 |
—3354 |
3.90 |
1990 |
4.23 |
|
1492 |
4.36 |
—2957 |
4.32 |
2209 |
4.05 |
|
itfl |
4.43 |
||||
CONCLUSIONS
Schwarzschild (1949) holds that variations in solar activity are caused by oscillations of the sun that range over decades. Waldmeier (1955) supports this thesis. Regarding the results presented in this paper, Schwarzschild's opinion could prove true in the sense of the working hypothesis defined in the introduction. It has been substantiated by the permanent 79 YC and the quantitative criteria Cnl to Cn3 showing a good practical reliability. These relations should be intriguing enough to induce theorists competent in the field of magnetohydrodynamis to develop thorough quantitative models. Meanwhile, the lack in elaborate theory does not impair the heuristic importance of the results. Epistemologically the stage of gathering data, establishing morphological relations, and setting up working hypotheses necessarily precedes the stage of elaborated theories.
As to practice, it seems possible now to calculate the date, the phase, and the amplitude of long-term solar variations in past and future. It is no longer necessary to recur to ultralong cycles with a duration of hundreds or thousands of years. The irregular distribution of the rare impulses of the torque of great strength offers a simpler explanation of ultralong-term variations. Fig. 4 shows the future course of the 79 YC. The next negative RDM will be released in 1990. It meets the criterion Cn2. The amplitude can be assessed by the Sit-value which is equal to| 4.23| U. The minimum about 1811 reached only 2It =| 4.07| U. Relatively small differences in the 2It-data lead to relatively great differences in the amplitudes. This can be seen from Table 2. Thus it may be expected that the negative RDM 1990 will be distinctly more pronounced than the 1811-minimum. The relatively high level of activity in cycle 21 is not opposed to this prediction. The very weak 11 YC No 5 (RM = 49) for instance was the immediate successor of the energetic 11 YC No 4 (RM = 141). A further negative RDM meeting the criterion Cn2 will occur in 2209. The respective 2 It-value is equal to | 4.05| U which is on the level of —RDM 1811. Fortunately, up to 2248 no negative RDM of the Cn3-category is in sight. The calculations do not go beyond this date.
In the last millenium the world's climate has undergone changes which correspond closely in date, phase, and amplitude with the sun's long-term variations in question (Gates and Mintz, 1975). The Spoerer-Minimum and the Maunder Minimum match the so-called Little Ice Age (Eddy, 1977). Regarding this link, exact predictions in the sun's secular cycle including quantitative evaluations constitute a valuable means of providing for the future as to power generation for instance. Characteristically, the last great advance of Alpine glaciers, though not as prolonged as during grand minima, occurred in the decades after 1810 (Rudloff, 1967). It is to be expected that the climatic conditions in at least three decades after 1990 will be more severe than after 1811 as corresponds to the ratio 2 lt = |4.071 U(RDM 1811) toSlt =|4.23| U (RDM 1990) compared with 2 |t = l 4.43| U (RDM 1671).
The Sumerian Minimum though released by a single negative RDM(Cn3) was accompanied by glacier expansion going as far as the glacial advance related to the combined Egyptian, Homeric, and Greek Minima (Denton and Karlen, 1973) which was released by five RDM(Cn3). As pointed out above, this could be due to the phenomenon that the solar modulation effect increases when the strength of the Earth's magnetic field decreases. Possibly, the sites where negative RDM(Cn3) occur in relation to the archeomagnetic sine curve shift very slowly in the course of many thousand years. If this were true, frequent consecutive RDM(Cn3) coinciding with the minimum in the sine curve could release grand minima with severe climatic implications. In case such structure would persist for many thousand years, these conditions could be favorable for glaciation, especially if coinciding with changing ocean and continent geometries and other possible causes of glacial periods.
Pursued investigations into the sun's motion about the center of mass of the solar system should lead to an improved understanding of long-term variations. There is evidence that special phases in the sun's osscillations about CM also influence short-term variations in solar activity. A long-range forecast of periods of enhanced activity of energetic flares based on such relations proved successful. The prediction covering the year 1979 was published at the beginning of the forecast period and controlled by W. Gleissberg, J. Pf leiderer, H. Woehl and the Space Environment Services Center, Boulder, U.S.A. A X2-test yielded highly significant results (P = 0.000044). All observed x-ray bursts § X2, proton events, and Polar Cap Absorptions agreed with the predicted intervals. This was also true of the first half-year of the.prediction for 1980.
ACKNOWLEDGEMENTS
I thank W. Gleissberg for his encouragement to write this paper and for his helpful comments on the first version of the manuscript.
The plot in Fig. 2 has been taken from Festschrift zum 25-jahrigen Bestehen des Instituts fur Ionospharenphysik in Lindau am Harz (1972); H. Schwentek, Solar-terrestrische Beziehungen, pp. 34-43.
REFERENCES
ANDERSON, R. and KOOPMANNS, H. (1963): Harmonic analysis of varve time series. J. geophys. Res., 68: 877.
COHEN, T. J. and LINTZ, P. R. (1974): Long term periodicities in the sunspot cycle. Nature, 250: 398-400.
COLE, T. W. (1973): Periodicities in solar activity. Solar Physics, 30: 103-110.
DAMON, P. E. (1970): Radiocarbon variations and absolute chronology. Ed. Olsson, I. V. Almqvist 8c Wiksell, Stockholm, 571.
DAMON, P. E. (1977): Solar induced variations of energetic particles at one AU. Ed. White, O. R.: The solar output and its variation. Colorado Associated University Press, Boulder, 429-448.
DENTON, G. and KARLEN, W. (1973): Quarternary Res., 3, 2: 155.
EDDY, J. A. (1976): The Maunder Minimum. Science, 192: 1189-1202.
EDDY, J. A. (1977): The case of the missing sunspots. Scient. Amer. 236: 80-92.
EDDY, J. A. (1977a): Historical evidence for the existence of the solar cycle. Ed. White, O. R. (1977): The solar output and its variation. Colorado Associated University Press, Boulder, 51-71.
GATES, W. L. and MINTZ, Y. (1975): Understanding climatic change. Appendix A, National Academy of Sciences, Washington.
GLEISSBERG, W. (1952): Die Haufigkeit der Sonnenflecken. Akademie-Verlag, Berlin.
GLEISSBERG, W. (1957): Die Zyklen der Sonnentatigkeit. Wiss. Ann., 6: 735-745.
GLEISSBERG, W. (1958): The 80-year sunspot cycle. J. Brit. Astron. Ass., 68: 150.
GLEISSBERG, W. (1975): Gibt es in der Sonnenfleckenhaufigkeit eine 179-jahrige Wieder-holungstendez? Verdff. Astron. Inst. Univ. Frankfurt, 57: 2, 11.
GLEISSBERG, W. (1976): Das jringste Maximum des 80-jahrigen Sonnenfleckenzyklus. Kleinheubacher Ber., 19: 661.
GLEISSBERG, W. (1977): Betrachtungen zum Maunder Minimum der Sonnentatigkeit. Sterne u. Weltr., 16:229-233.
GLEISSBERG, W. (1979): Reflections on the Maunder Minimum of sunspots. J. Brit. Astron. Ass., 89: 440-449.
HARTMANN, R. (1971): A new representation of the 80-year cycle in sunspot frequency.' Solar Physics, 21:246-248.
HARTMANN, R. (1972): Vorlдufige Epochen der Maxiraa und Minima des 80-jдhrigen Sonnenfleckenzyklus. Verцff. Astron. Inst. Univ. Frankfurt, 50: 118. JOSE, P.D. (1965): Sun's motion and sunspots. Astron. J., 70: 193-200.
LEIGHTON, R. B. (1969): Astrophys. J„ 156: 1. LIN, Y. C, FAN, C. Y., DДMON, P. E. and WALLICK, E. J. (1975): 14th Int. Cosm. Ray Conf., Muenchen 3, 995.
MAXIMOV, J. W. (1953): On secular variations in solar activity. Dokl. Akad. Nauk, 92: 1149-1152.
PARKER, E. N. (1955): Astroph. J., 122: 293.
PARLENKO, G. E. (1933): Oberflдchenwellen auf einer in einem bewegten Tank enthaltenen Flьssigkeit. Phil. Mag., 360.
RUDLOFF, H. v. (1967): Die Schwankungen und Pendelungen des Klimas in Europa seit dem Beginn der regelmдssigen Instrumenten-Beobachtungen, Friedr. Vieweg & Sohn, Braunschweig, 254.
SCHOVE, D. J. (1955): The sunspot cycle 649 BC to AD 2000. J. geophys. Res., 60: 127.
SCHWARZSCHILD, M. (1949): Ann. Astroph. 12: 148.
STIX, M. (1974):Commentson the solar dynamo. Astron. Astrophysics, 37: 121-133.
STUIVER, M. (1961): J. geophys. Res., 66: 273.
STUIVER, M. (1965): Science 149, 533.
SUESS, H. E. (1968): Meteor. Monog. 8: 146.
WALDMEIER, M. (1955): Ergebnisse und Probleme der Sonnenforschung. Akademische Ver-lagsges., Leipzig, 200. WALDMEiER, M. (1961): The sunspot activity in the years 1610-1960. Schulthessfe Co., Zь'rich,
WITTMANN, A. (1978): The sunspot cycle betцre the Maunder Minimum. Astron. Astrophysics, 66: 93-97. WOOD, R. M. (1975): Comparison of sunspot periods with planetary synodic period resonances. Nature, 255: 312-313.
Published on http://bourabai.narod.ru/
according permission of Frau Christiane Landscheidt