
SOLAR WIND NEAR EARTH: INDICATOR OF VARIATIONS IN GLOBAL TEMPERATURE
Theodor Landscheidt
Schroeter Institute for Research in Cycles of Solar Activity
Abstract. Near-Earth variations in the solar wind, measured by the geomagnetic aa index since 1868, are closely correlated with global temperature (r = 0.96; P < 10-7). Geomagnetic activity leads temperature by 4 to 8 years. Allowing for this temperature lag, an outstanding aa peak around 1990 could explain the high global temperature in 1998. After 1990 the geomagnetic aa data show a steep decline comparable to the decrease between 1955 and 1967, followed by falling temperatures from 1961 through 1973 in spite of growing anthropogenic CO2 emissions. This points to decreasing global temperature during the next 10 years.
Introduction
The total magnetic flux leaving the Sun, dragged out by the solar wind, has risen by a factor of 2.3 since 1901 (Lock-wood et al, 1999). Concomitantly, global temperature has increased by 0.5° C. The energy in the solar flux is transferred to the near-Earth environment by magnetic reconnec-tion and directly into the atmosphere by charged particles. There are indications that this energy has meteorological effects within days after solar eruptions which generate highspeed streams in the solar wind (Roberts and Olson, 1973; King, 1974; Stolov and Shapiro, 1974; Schuurmans, 1979; Prohaska and Willett, 1983; Neubauer, 1983; Bucha, 1983; Herman and Goldberg, 1985; Tinsley, 1996). As there is a linear relationship between magnetic flux and solar irradi-ance, the 130% rise in the Sun's magnetic flux since 1901 indicates a rise in the average total solar irradiance of 1.65 W m-2 (Lockwood and Stamper, 1999). The respective radiative forcing in the atmosphere is 0.29 W m-2, corresponding to 0.23° C at a moderate climate sensitivity of 0.8° C/W m-2. This increase of 0.23° C potentially accounts for nearly half of the change in the Earth's global temperature over the same period. Charged particles and indirect solar wind effects make a strong additional contribution.
Svensmark and Friis-Christensen (1997) have shown that global cloud cover, observed by satellites, is linked to the strength of galactic cosmic rays modulated by the solar wind (r = 0.95). This effect, attributed to cloud seeding by ionized secondary particles (Pruppacher and Klett, 1997), induced a change in cloud cover by more than 3% within 3 Vi years. The corresponding change in radiative forcing is in the range 0.8 tol.7 W m-2. This is significant, as the total radiative forcing by CO, accumulated in the atmosphere since pre-industrial times is about 1.5 W m-2. Measurements of cosmic ray flux registering myons instead of neutrons go back to 1937. When Svensmark (1998) compared these data with temperature in the Northern Hemisphere, his results were corroborated. Short-term observations confirm the connection. Forbush decreases - sudden deep drops in cosmic ray flux within 2 days after energetic solar eruptions - coincide with local shrinking of cloud cover by 3% (Pudovkin and Veretenenko (1995). In the long run, climate would not be affected if the amplitude of the indirect solar wind effect on clouds did not change. The strength of the solar wind, however, has increased by a factor of 2.3 since 1901.
Direct and indirect effects, taken together, point to a dominant role of solar activity in climate change. Accordingly, many of the recent publications in the field of solar-terrestrial relationships range the Sun's contribution between 50 and 100 % (Friis-Christensen and Lassen, 1991; Lean et al., 1995; Lau and Weng, 1995; Landscheidt, 1995; Soon et al., 1996; Svensmark and Friis-Christensen, 1997; Reid, 1997; White et al., 1997; Svensmark, 1998; Cliver et al. 1998 a, b; Labitzke, 1999).
Correlation analysis
The strongest contributors to the solar wind intensity are energetic solar eruptions (coronal mass ejections, flares, and eruptive prominences) which create the highest velocities in the solar wind and shock waves that compress and intensify magnetic fields in the solar wind plasma. Coronal holes have a similar effect. So it suggests itself to investigate whether periods of strong plasma ejections on the Sun are connected with temperature on Earth. Not all strong eruptions have an impact on the near-Earth environment. The effect at Earth depends on the heliographic position of the eruptions and conditions in interplanetary space. Indices of geomagnetic disturbances measure the response to those eruptions that actually affect the Earth. Mayaud's aa index of geomagnetic activity (Mayaud, 1973; Coffey, 1958-1999) is homogeneous and covers the long period 1868 to present. So I compared it with temperature. The correlation between temperature and the length of the 11 -year sunspot cycle, established by Friis-Christensen and Lassen (1991), only covers land air temperature. Hence I selected a time series that combines Northern Hemisphere land air temperature anomalies (Jones, 1994) with sea surface temperature anomalies (Parker et al., 1995). A scatter plot of the raw yearly data shows a promising positive correlation between aa and temperature (r = 0.48).
Figure 1. Scatter plot of yearly means of the geomagnetic aa index and Northern Hemisphere land air and sea surface temperature anomalies 1868 -1998. The aa data are shifted to offset a 6-year lag of temperature. The slope of the regression line and the aggregation of the slightly smoothed data around the straight line fit indicate a close correlation (r = 0.75) which is highly significant ( P < 10-7).
If there were a causal connection, temperature should lag the aa index. So I computed the correlation coefficients for different lags and found that the correlation reaches a maximum when temperature lags aa by 6 years. The scatter plot in Fig. 1 is based on aa data that were shifted by 6 years to offset the temperature lag. The data were subjected to three-point smoothing. The least-squares linear fit line indicates a strong correlation (r = 0.75) which explains 56% of the variance. This correlation is highly significant. After the shift, the record of yearly means is reduced from 131 to 125 data points as the data lost by shifting cannot be replaced. Three-point smoothing, applied once, reduces the number of independent data to 42. Autocorrelation within the two time series is taken into consideration by diminishing the number of the degrees of freedom (Schonwiese, 1985) to 35. The t method (Chambers, 1952) yields t = 6.7. The rejection of the null hypothesis is justified at a high level of significance: P = 9- 10-8. The t-test can be applied as both of the time series are close to a normal distribution. Spearman's parameterfree rank correlation coefficient yields the same level of significance. Randomization tests (Edgington, 1995) and bootstrap resampling confirm this result.
The Trellis graph in Fig. 2 shows how the correlation presented in Fig. 1 varies with different aa values. The respective subclass of aa values is indicated at the top of the different panels. The shaded rectangles represent the width of the respective class and its subrange within the total aa range. Consistently, the weakest aa values between 6.8 and 12.9 (bottom left) show no correlation with temperature at all, whereas the highest values between 25.6 and 30.6 (top right) indicate the strongest correlation. The Trellis graph also demonstrates how the correlation develops over time. The strongest correlation concentrates on the period from 1955 through present. This is in contradiction to assertions in the literature (Tett et al., 1999) that there was only a negligible effect of solar activity on temperature in the second half of the century and especially in the two last decades.
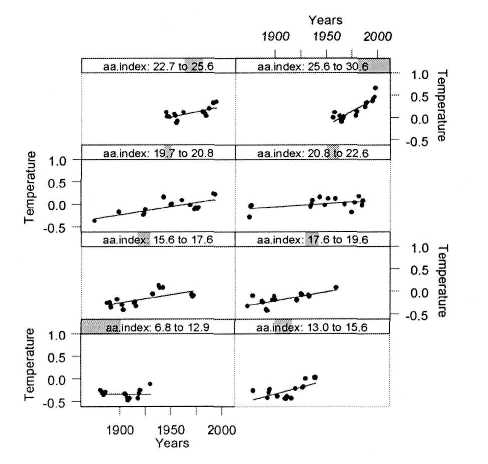
Figure 2. Trellis graph of the data presented in Fig. 1. The panels show scatter plots for different classes of aa. Shaded rectangles indicate the width of the respective class and its location within the total aa range. The weakest aa values (6.8 -12.9) show no correlation with temperature in a period around 1900. The highest aa values (25.6 -30.6) display the strongest correlation covering the period 1955 - 1998.
The correlation between temperature and solar cycle length, established by Friis-Christensen and Lassen (1991), covers only the Northern Hemisphere. There is also no clear indication of solar activity, the presumed cause, leading temperature, the effect. This is also true of a correlation between decadal aa data and temperature found by Cliver et al. (1998 a) which otherwise corroborates the result presented here, though on a much lower level of significance, as it is solely based on 7 independent data points.The result in Fig. 3 is not exposed to such objections. The vertical axis on the left measures yearly global surface temperature anomalies combining land and marine records (Jones, 1994; Parker et al., 1995).
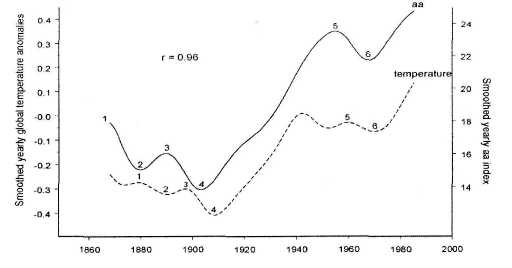
Figure 3. The solid curve shows the aa index of geomagnetic activity, the dashed curve a combination of global land air and sea surface temperature anomalies. The yearly data were subjected to repeated three-point smoothing. Temperature lags aa by 4 to 8 years, but follows the undulations of the aa curve. The connection between the leading aa extrema and the following temperature extrema is highlighted by identical numbers. A disturbance of the correlation around 1940 points to exceptional internal forcing.
The axis of ordinates on the right indicates the original yearly aa index without any offset. The original data were subjected to repeated three-point smoothing. These strongly smoothed data, covering 1868 - 1985, show a very close correlation between geomagnetic activity, driven by high-speed plasma streams in the solar wind, and global land and sea surface temperatures (r = 0.96). This correlation explains 92% of the variance. As this result is based on the data that have already been shown to be highly significant, it can be considered valid. Temperature lags aa on the average by 6 years. The lag varies from 4 to 8 years. The related extrema in the two curves are marked by identical numbers. The temperature curve follows the undulations of the aa curve. There is only one exception. After 1942 temperature did no longer follow the ascent of aa and formed a shallow trough not emerging in the aa curve. An explanation could be that between 1942 and 1952 the steepest rise in volcanic activity since 1860 was observed (Simkin et al., 1981).
The lag of the temperature data suggests that some of the excess energy linked to solar activity is stored and accumulated in the climate system by processes taking years. The thermal inertia of oceans may offer an explanation. White et al. (1997) have shown how the oceans respond to excess insolation caused by solar forcing and why there is a lag of several years depending on the length of the involved cycles of solar activity. According to Wigley (1988) an 80-year cycle of irradiance would yield an atmospheric temperature response with a lag of 7 to 9 years. The secular cycle of solar activity, modulating the intensity of the 11-year cycle, has a mean length of 80 - 90 years.
Long-range forecast of global temperature
The presented results suggest that future change in global temperature may be read from the leading aa data. Fig. 4 shows the repeatedly smoothed yearly global land and sea surface temperature anomalies and aa values after 1985. Around 1990 the aa curve reached the highest maximum since the beginning of the record in 1868. This aa maximum is marked by the number 7. Allowing for a lag of 8 years, the corresponding maximum 7 of global temperature could have occurred in 1998 with the highest temperature measured since the establishment of regular meteorological services.
After 1990 the aa data show a steep decline that is still continuing though the current sunspot cycle has reached its maximum. In the context presented here, this points to global cooling during the decade after temperature maximum 7.
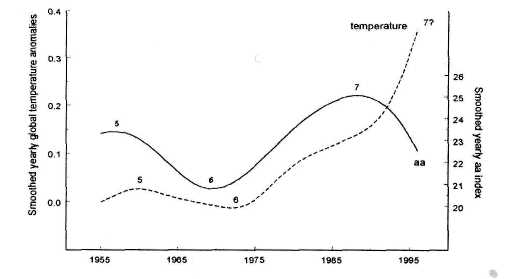
Figure 4. Extension of the data in Fig. 3. The aa curve reaches its highest maximum, marked by number 7, around 1990. After 1990 the aa data show a steep decline. Allowing for a lag of 8 years, a maximum in the curve of global temperature could have occurred around 1998. This was the year with the highest temperature observed since the establishment of international meteorological services. In 1999 the temperature was considerably lower, especially in the Southern Hemisphere. This relationship points to global cooling for at least 10 years.
Actually the global temperature in 1999 was much lower than in 1998, especially in the Southern Hemisphere. Satellites observed negative anomalies. As the investigated relationship seems to be solid, we should see falling temperatures at least during the next ten years. The decline in the aa curve after maximum 7 is steeper than after maximum 5. So global temperature should fall at a faster rate than after temperatur maximum 5.
Anthropogenic CO2 contributions should not be an obstacle to such decrease, as temperatures were falling from the early sixties through the early seventies in spite of the fast rise of anthropogenic CO2 emissions. The increase in surface temperature from 1910 to 1940 was steeper and smoother than in the current warming phase though the rate of anthropogenic emissions at that time was only 10% of the present rate. In view of insufficient data, lacking knowledge of complex feedback processes in the climate system, and controversial hypotheses the outcome of the forecast experiment should contribute to answering the question to which degree solar activity and human greenhouse gas contributions force global temperature.
Energy problems
Willis (1976) has calculated that the solar wind energy flux is less than one millionth of the Sun's electromagnetic power deposited near Earth. However, this estimation is based on the total cross-sectional area of the globe. It does not take into account that the solar wind energy may preferentially penetrate into areas smaller than the total disk where it can dominate other energy sources. Herman and Goldberg (1978) have shown that the solar wind energy concentrates on a narrow circumpolar latitude belt near the auroral zone. Taking additionally into account the slant incidence of the Sun's radiant flux, they calculated that the available power of the solar wind would reach 20% of the Sun's electomagnetic energy flux. If Svensmark could show in detail in his laboratory experiments, planned in cooperation with CERN, how galactic cosmic rays, regulated by the solar wind, affect cloud development, we would even have to concede that the energy of starlight is sufficient to affect climate. Cosmic rays and starlight inject nearly the same amount of energy into the atmosphere.
References
Published on http://bourabai.narod.ru/ according permission of Frau Christiane Landscheidt