SOLAR ROTATION, IMPULSES OF THE TORQUE IN THE SUN'S MOTION, AND CLIMATIC VARIATION
T. LANDSCHEIDT
Schroeter Institute for Research in Cycles of Solar Activity
Climatic Change 12 (1988) 265-295 © by Kluwer Academic Publishers
(Received 26 February, 1987; in revised form 30 November, 1987)
Abstract.
Running variance analysis and maximum entropy spectral analysis applied to Mount Wilson rotation data yield arguments in favor of a connection between variations in the Sun's rotation rate, energetic X-ray flares, and impulses of the torque (IOT) in the Sun's irregular motion about the barycenter of the planetary system. Such IOT, that have been shown to be related to the secular cycle of solar activity and excursions of the Maunder minimum type, also seem to be linked to outstanding peaks in geomagnetic activity, maxima in ozone concentration, incidence of blocking type circulation, as well as rainfall over Central Europe, England/Wales, eastern United States, and India. Statistical tests, that confirm these links, additionally point to IOT connection with temperature in Central Europe and the number of icebergs that pass south of latitude 48° N. IOT relationship with X-ray flares and strong geomagnetic storms was tested in successful long range forecasts.1. Role of Solar X-Rays, X-Class Flares, and the Earth's Magnetosphere in Solar-Terrestrial Interaction
Most past efforts concerning Sun-weather connections have looked for direct relations to visible solar activity, especially sunspots. Literature is replete with statistical results, but most scientists hold that the case is still unresolved. According to Eddy (1977, 1979, 1982) it is possible that solar connections have been sought in the wrong places or with the wrong index of solar activity. Observations of the Sun by means of satellite instrumentation have revealed strong fluctuations in the unseen ultraviolet and X-ray portions of the Sun's electromagnetic spectrum that show no distinct correlation with short range variations in sunspots. Thus they could have been missed in earlier searches for solar-terrestrial effects based on optical observations.
X-rays below 10 A, emitted by energetic X-ray flares, are an important source of ionization in the D-region of the ionosphere where they generate Sudden Ionospheric Disturbances (SID) including short wave fade-out (SWF) and magnetic crochet, also called solar flare effect in the geomagnetic record (SFE). X-rays in the range 1-10 A, that increase by a factor of a hundred and more with the incidence of energetic X-ray flares, penetrate down into the atmosphere to heights about 60 to 70 km. This boundary region of the ionosphere is together the upper surface of the global atmospheric electrical circuit maintained by the thunderstorm generator.
According to a model developed by Markson (1979; 1983) solar modulated ionizing radiation lowers the columnar resistance over thunderstorms and thus causes a greater current to flow to the "equipotential" ionosphere and thence through the fair-weather portions of the circuit back to earth. This would increase the electric field in the fair-weather regions including those in the vicinity of developing clouds. As many thunderstorm charging mechanisms depend on electrostatic induction on cloud drops, the eventual electrification of clouds may be a function of the initial electric field intensity, and stronger electric fields would enhance thunderstorm activity on a global basis. Furthermore, the convective charging mechanism seems to depend on conduction over thunderclouds to allow charge to move from the upper atmosphere to the cloud. Eventually, intense electric fields could greatly increase the coalescence of small droplets into large raindrops.
Markson's model is based on the classical theory of atmospheric electricity in which the circuit's upper branch is a nearly globally uniform ionosphere of high conductivity that is bounded by an equipotential surface at a height of 60 to 70 km that separates the global circuit from the ionosphere by shielding effects. From this follows that only variations in the vertical columnar resistance can affect the distribution of the current and the fair weather electric fields. The total resistance of the atmosphere in the fair-weather portion of the circuit is only a few hundred ohms, whereas the resistance above the thunderstorm generator can reach 106 Q. Therefore Markson stresses that only an increase in ionizing radiation that penetrates sufficiently low into the atmospheric column above thunderstorms is to be expected to modulate the current in the global circuit. Only relatively rare energetic solar particle events, that occur two or three times a year, and galactic cosmic rays meet these requirements. Cosmic rays do not match observation. According to Reiter (1969, 1971) and Cobb (1967) a sharp increase in air-earth current density was observed at mid-latitude sites immediately after solar flares, and Bossolasco et al. (1972) found a 70% increase in thunderstorm incidence within a few days after flares. Since flares contribute to solar system screening from cosmic rays by producing shock waves that merge to form a protecting shell around the heliosphere (Schwenn and Rosenbauer, 1984), simultaneous increase in galactic cosmic rays and flares are mutually exclusive.
As to solar flares, Hale (1979, 1983) has objected that events emitting energetic particles that pervade the column above thunderstorms do not occur frequently enough to explain the observed effect. With regard to these difficulties Newell (1983) has suggested that solar X-rays might also help to regulate the global circuit which could occur by means of an X-ray effect on the circuit's upper branch, even though such a process goes against classical concepts of atmospheric electricity. It is worth considering that just the 'equipotential surface' is part of the D-layer of the ionosphere that is subject to drastic changes in ionization incompatible with the classical notion of a uniform conductivity of the ionosphere. This part of the atmosphere could rather be characterized as extremely non-uniform (Hale, 1983). There is, too, considerable departure from the assumed exponential form of the ionosphere's electrical conductivity profile (Roble, 1983). In addition, there are indications of an intermediate mesospheric circuit modulating the lower atmosphere circuit (Hale, 1983). Electrical perturbations induced by either the ionospheric wind dynamo, or the magneto-sphere dynamo, that both generate large-scale horizontal potential differences within the ionosphere, could map downward to lower latitudes (Roble, 1985). The so-called equipotential surface that connects the ionosphere and the global circuit possibly plays an important role in their coupling. Flare generated X-rays penetrate down to this boundary region. Thus, an investigation into solar X-ray bursts may be expected to meet general interest of climatologists as well as ionospheric physicists.
Yet the potentially controversial nature of this approach must be recognized. The complexities of both solar and atmospherics physics and solar-terrestrial interaction are such that this interdisciplinary field of research will continue |o be subject to incessant debate and controversy until it reaches a less rudimentary state of development. The setting up and testing of varied working hypotheses will contribute to a better understanding of the intricate web of solar-terrestrial interaction. Attention should be focused on the single meshes of this web. Climate is the integral of weather, and sunspot cycles have weight in solar-terrestrial relations because they represent the integral of the effects of single features of solar activity that have an impact on the earth. Even single sunspots or sunspot groups solely constitute a potential for solar-terrestrial interaction which is actually released by flares, disappearing filaments, and coronal holes that all contribute to the fast solar wind. The bulk flow speed of the solar wind, that is indicative of solar mass ejections and resultant shock waves, is strongly coupled to geomagnetic activity (Gosling et al., 1977), which in turn seems to be the common factor of a wide variety of terrestrial phenomena. This establishes the possibility of a further connection with solar X-rays, as will be shown.
Many authors including Sazonov (1965), Mustel (1966), Beynon and Winstanley (1969), Stolov and Shapiro (1974), and Sidorenkov (1974) have reported connections between geomagnetic disturbances and phenomena in the troposphere. Cobb (1967) has shown that the monthly variation of the air-earth current from mean values at Mauna Loa, Hawaii, is correlated with Bartel's magnetic character index Cp. According to Mustel (1977) surface pressure increases in anticyclones and decreases in cyclones after isolated geomagnetic storms. King (1974) has reported similar results. In a study that covers the years 1964 to 1971, Roberts and Olson (1973) have found that troughs which enter the Gulf of Alaska or are formed there two to four days after a sharp increase in geomagnetic activity tend to be larger than average size. Prohaska and Willett (1983) applied Eigen-analysis technique to a matrix of cross-correlation coefficients between the geomagnetic aa-index and the monthly mean temperature at 32 United States stations, and isolated temperature anomaly patterns that are highly correlated with the aa-index. As this index is considered a strong descriptor of the solar wind, Prohaska and Willett hold that the source of the effect influencing the local temperature field through the atmospheric circulation is also driving the solar wind and disturbing the geomagnetic field.
Sazonov (1974) and King (1974) have drawn attention to the similarity between meteorological and geomagnetic contour maps. Bucha (1983) has demonstrated that in Europe and North America the prevalence of zonal or meridional circulation is dependent on the incidence of geomagnetic storms. 13 to 20 days after sudden commencements, caused by solar activity, a pronounced increase in temperature occurs due to prevailing zonal circulation, whereas lull periods in geomagnetic activity lead to meridional flow and drops in temperature induced by Arctic air. A statistical analysis of this connection covering the years 1955 to 1978 yielded the correlation coefficient r = 0.65. Bucha has tried to give a geophysical explanation of this correlation. Neubauer (1983) has discovered that sudden commencements of geomagnetic storms are related to displacements in the 70 mb polar vortex in the lower stratosphere, which in turn influence the polar vortex in the troposphere. The shift in the 70 mb polar vortex is caused by a localized sudden stratospheric warming. Of 66 magnetic storms observed during the winters 1978/1979 and 1979/1980, as much as 61 were accompanied by such stratospheric warming. According to Neubauer this effect can be explained by geophysical processes. There are indications that explosive volcanic activity is related to changes in weather and climate (Schneider and Mass, 1975). It is not out of the question that variations in the torque exerted by the solar wind on the earth's magnetosphere have an influence on volcanic activity via changes in the earth's rotational velocity and the motion of plates with respect to one another (Landscheidt, 1987).
Some of these results may be spurious. Nevertheless, one of the few common threads that appear so widely in the otherwise disparate literature as to suggest that they probably have some validity, is the link between geomagnetic storms and meteorological or geophysical responses (Wilcox, 1975). The Executive Committee of the International Working Group on Magnetic Field Satellites holds that there is an apparent relationship in the geomagnetic secular change to the length of the day and average global temperature on a decade time scale, suggesting that several of the major physical forces on the earth may be interrelated (EOS, 1985). Thus, long term prediction of geomagnetic activity seems to be important, both for space mission planning and testing empirical understanding of the impact of the fast solar wind on the earth's magnetosphere and possible meteorological responses.
Solar X-rays must be considered a weighty factor in techniques intended for predictions of geomagnetic storms. Most strong geomagnetic disturbances are caused by flares. The intensity of optical flares, however, is a poor indicator of the probability that a flare will cause a geomagnetic storm. The percentage improves dramatically when only flares are considered that emit X-rays the intensity of which goes beyond 0.1 erg cm-2 s-1 (X class event) (Joselyn, 1986).
Erupting filaments are another source of geomagnetic storms. The most consistent signature of possible geomagnetic activity following a filament disappearance is emission of strong X-rays (Joselyn, 1986). A third source of geomagnetic disturbances are coronal holes. Interestingly, they can be released by energetic flares (Recely et al., 1986), that are accompanied by X-ray bursts. Symptomati-cally, a solar X-ray imager will be mounted on a satellite that is due to be launched into geostationary orbit in the early 1990s and is expected to greatly improve the forecasting of solar flares in producing predictions at least 20 minutes in advance (EOS, 1987). This points to the importance a long range forecast of solar X-ray bursts would have. It will be shown that impulses of the torque in the Sun's motion about the center of mass of the solar system show a connection with solar X-ray events that might provide a basis for predictions of such events and their terrestrial responses.
2. The Sun's Rotation and Solar Activity
The Sun's rotation on its axis is related to solar activity. The interaction of differential rotation, the general magnetic field, and convection in the solar plasma is thought to cause dynamo action that generates the sunspot cycle by magnetic-field amplification. Correspondingly, the Sun's rotation shows a connection with the level of solar activity. According to Eddy (1977) it can be derived from drawings by Scheiner (1625-1626) and Hevelius (1642-1644) that the Sun's equator had speeded up at the beginning of the Maunder minimum, completing a rotation one full day faster than two decades earlier. Comparable variation has been found in relation to the 11-year sunspot cycle. The fastest equatorial rotation is observed at the sunspot minimum and a slower rate around the maximum (Chistyakov, 1976; Godoli and Mazzucconi, 1979; Balthasar and Woehl, 1980; Howard, 1984).
But in detail the variation is rather complex. Clark et al. (1979) found that solar rotation depends on the amplitude of the solar cycle. They compared the velocity of unipolar spots observed during the solar maxima 1884 and 1957 and found that in 1957, when the sunspot activity was nearly three times more intense than in 1984, the differential rotation at the latitude 30° took half a day longer than in 1884, whereas the rate of rotation at the equator showed no difference. The analysis by Balthasar and Woehl (1980; 1986) disclosed that there are several secondary maxima and minima in the rotational velocity in that phase of the cycle that generally goes along with slower rotation. The graphical superposition based on data of the years 1940 to 1968 shows such extrema at intervals of 3 to 4 years. Investigations by Gilman and Howard (1984) show similar results. As yet, it is not clear whether such changes in the Sun's differential rotation are the cause of variation in the solar activity or an effect.
3. Impulses of the Torque (IOT) in the Sun's Motion about the Center of Mass CM and Spin-Orbit Coupling
It would be a progress in the endeavour to answer such questions and to forecast solar activity and its terrestrial effects if special features in the Sun's rotation proved to be related together to variation in solar activity and to solar system parameters accessible to computation. Strong impulses of the torque (IOT) in the Sun's motion about CM seem to meet these requirements. They have been shown to regulate or modulate different kinds of cycles of solar activity including a supersecular cycle of 391 years, a secular cycle of 83 years, a 31-year cycle, the 11 -year cycle, and long- and short range flare cycles (Landscheidt, 1976; 1980; 1981; 1983; 1984; 1986a; 1986b; 1987). Such impulses of the torque, measured by the time integral
![]()
(the torque is defined by T=dL/dt, which is the first derivative of the angular momentum of the Sun's orbital motion) occur when T approaches zero, changes sign and shows a more or less sharp increase in the new direction measured in the time interval t1 — t0 = 300 days.
While the Sun describes a very irregular helix around the elliptic line of motion of CM, its orbital momentum can vary from about -0.1 x 1047 g cm2 s-1 to about +4.3 x 1047 g cm2 s-1, which is an increase by a factor of up to 40 and more. The maximum value of orbital momentum reaches 25% of the Sun's rotational momentum which is 1.7 x 1048 gem2 s-1. If there were spin-orbit coupling, a transfer of angular momentum from the Sun's orbit to the Sun's spin rate or vice versa, this could make a difference of more than 5% in the equatorial velocity which is actually observed (Howard, 1975, 1984).
It is not far-fetched to speculate on such transfer, as coupling could result from the Sun's motion through its own electric and magnetic fields that are relatively strong near the Sun's body. At a height of one solar diameter above the Sun's surface the electron density is still about 1 million electrons per cm3. The maximum distance of the Sun's center from CM is 2.19 solar radii (Jose, 1965); yet the average distance is about 1.1 solar radii. Thus this part of the low corona can act as a brake on the surface of the Sun (Dicke, 1964). There is sufficient potential of angular momentum to draw on. The giant planets Jupiter to Neptune, that regulate the Sun's motion around CM, hold more than 99% of the total angular momentum of the system, whereas the Sun governs only 0.54%. Jupiter's share in the total momentum is 61%, enough to think of transfer of angular momentum from Jupiter to the revolving Sun and eventually to the spinning Sun mediated by gravitational coupling.
4. Epochs of IOT and Variation in the Sun's Rotation Rate
Considering these connections, it is of interest that IOT are initiated when the planet Jupiter, the center of mass CM, and the Sun's center are in line (JU-CM-CS). Such constellations occur at quasicyclic intervals with a mean period of 9.3 years. Calculation yields the following epochs since 1850: 1850.90; 1859.21; 1865.42; 1873.29; 1881.89; 1891.17; 1901.77; 1912.05; 1920.82; 1930.33; 1942.29; 1951.37; 1959.62; 1967.80; 1970.02; 1974.48; 1982.83. Future epochs in this century are 1990.30and 1998.56. There are two types of JU-CM-CS events: such that are accompanied with a sharp increase in orbital momentum and centrifugal motion (JU-CM-CSc), and those that go along with a decrease in orbital momentum and centripetal motion due to prevailing gravitation (JU-CM-CSg).
If there is spin-orbit coupling, it is to be expected that the Sun's spin momentum varies inversely with its orbital momentum. When early in this century solar spectrographs were greatly improved and fairly consistent results began to appear in measurements of the equatorial rotation rate (Howard, 1984), striking minima in the equatorial velocity were observed in 1911/1912 and in 1929/1930 (St. John, 1932; Perepelkin, 1933; Gelopolsky, 1933; Storey, 1932). They coincided in a consistent way with JU-CM-CSc in 1912.05 and 1930.33.
The early spectroscopic measurements were plagued by scattered light errors. Photoelectric measurements from full-disk scans promised to improve consider ably the precision of measurements. Such Mount Wilson observations (Howard, 1975) disclosed another spectacular decrease in the equatorial rotation rate. Exactly at the epoch of JU-CM-CSc in 1967.80 the rate fell from 14.5 to 12.1 degrees per day. The following JU-CM-CSc-event in 1974.48 again went along with slower rotation that varied distinctly from the average velocity level, as will
be shown in Figure 1.

Fig. 1. Smoothed running variance of the Sun's equatorial angular siderial rotation rate Ac covering Carrington rotations 1516 (December 1966) to 1726 (September 1982), epochs of JU-CM-CS events, and corresponding quasicycles and harmonics.
5. Quasicyclic Connection of IOT with Running Variance of Solar Rotation Data
Meanwhile, Doppler velocity measurements at Mount Wilson had been improved as to instrument and reduction procedures. They provided rotation results based on a single reduction method for the entire interval January 1967 to September 1982 (Howard et al., 1983; Howard, 1984), including rotation numbers 1516 (30 December, 1966) to 1726 (5 September, 1982). The available rotation values Ac represent the equatorial angular sidereal rotation rate corrected for scattered-light; they are averaged over the respective Carrington rotations. Figure 1 shows the running variance s2 of these data. The respective moving values s2 cover two consecutive rotations, thus measuring the variation in variability (Schonwiese, 1984) of Ac from rotation to rotation. The results have been subjected to a Gaussian low-pass filter eliminating short range features covering less than 5 rotations. The axis of abscissae designates the Carrington rotation numbers. The ordinate axis measures the smoothed relative variance v = s2. The epochs of JU-CM-CSc-events in 1967 and 1974 are marked by fat arrows, and the epoch of the 1970 JU-CM-CSg-event is indicated by a fat triangle.
The two c-events are related to prominent variance peaks significant at the 85% confidence level (CL) and beyond. If the running variance is not subjected to smoothing, the 1974 peak reaches the 95% confidence level. In Figure 1 there is only a small variance peak connected with the 1970 g-event. This points to a different quality of this kind of events, which was to be expected, as the orbital momentum becomes negative instead of positive. Nevertheless, g-events, too, seem to have an impact on the Sun's differential rotation. The Mount Wilson rotation data do not cover the JU-CM-CS event 1982.83. If consecutive events are thought to form quasicycles initiated by the respective foregoing event, there should emerge subcyclic effects in the rotation data, provided that they are related to the fundamental cycle.
The quasicycle initiated in 1974.48 had a period of 8.35 years, as the following JU-CM-CS event occurred in 1982.83. It can be seen in Figure 1 that the phases nil and n radians coincide with variance peaks that are significant at the 85% confidence level. In the unsmoothed running variance data these peaks even reach the 95% level. The corresponding phases are outstanding, too, in the quasicycle initiated by the g-event in 1970 and lasting till 1974.48. As can be read from Figure 1, the peaks at n/2 and n radians are near the 95% confidence level or go beyond. In the unsmoothed running variance data the corresponding peaks transcend the 95% and 99% confidence levels. As all variance maxima reaching or transgressing the 85% confidence level in Figure 1 and even higher levels in the unsmoothed data coincide with cyclic data of JU-CM-CS events, there is some support of a connection between the rotation rate of the Sun's surface layers and impulses of the torque initiated by JU-CM-CS constellations.
So far, only the equatorial rotation rate Ac has been investigated. As the Sun's differential rotation is rather complex, decelerations or accelerations in other latitudes may be involved. The results by Clark et al. (1979) have been mentioned already. A high-latitude variation was discovered by Livingston and Duvall (1979). A faster rotation at high latitudes is observed near solar activity maximum in contrast to the fast rotation at low latitudes near solar activity minimum. According to Howard and LaBonte (1980) this is due to torsional oscillations. The Sun is very easily excited in torsional oscillation modes that could cause low-amplitude modulation of the rotation rate (Howard, 1984). Thus, JU-CM-CS events going along with accelerations and decelerations in the orbital angular momentum could be involved.
6. Maximum Entropy Spectrum of Mount Wilson Rotation Data and Harmonics of IOT Cycles
There is a growing body of circumstantial evidence that JU-CM-CS events, too, influence ephemeral features in the Sun's activity. Most important is a strong connection with solar cosmic ray events, that are always accompanied with strong X-ray bursts (Sakurai, 1974). It has been demonstrated in Figure 1 that JU-CM-CS events form quasicycles and subcyclic features like the 2nd and 4th harmonic that can be identified by their mark on the Sun's rotation. Figure 2 is a confirmation of this result. It presents the maximum entropy spectrum of the Mount Wilson rotation data that were subject of the initial investigation that yielded Figure 1. Since 1967 Burg (1968; 1972; 1975) developed a new form of spectral variance analysis, the maximum entropy spectral method (MEM), which shows much higher resolution than earlier methods, especially at lower frequencies. It reaches an exactness and sharpness that matches the optical spectra. The spectrum in Figure 2 covers 211 data points (rotations No. 1516-December 1966 - to No. 1727 - October 1982) and is based on 70 filter coefficients. The frequency / is measured in millicycles per sampling interval of a Carrington rotation. The ordinate axis designates the relative power P of the respective frequencies. The spectrum is stable. A change in the number of filter coefficients does not generate spectral shifts.
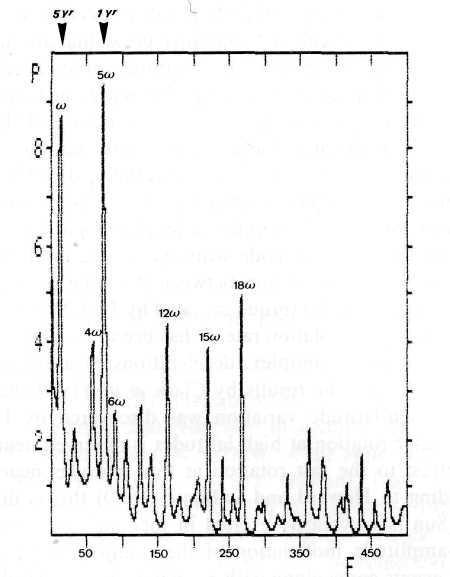
Fig. 2. Maximum entropy spectrum of the Mount Wilson data presented in Figure 1. The prominent peaks represent the mean period of JU-CM-CS cycles 1967.8 to 1982.8 as well as the corresponding harmonics 4co, 5a>, 6co, or multiples of these frequencies. .
The prominent low frequency peak, the fundamental co, has a period of 66.67 Carrington rotations or 5 years. This is exactly the mean interval of the JU-CM-CS events involved (1967.8, 1970, 1974.5, 1982.8; (2.2 yr + 4.45 yr+ 8.35 yr)/3 = 5 yr). The outstanding harmonic is 5<x> with the period 1 year. It is known in the physics of vibrating systems, especially that of vibrating strings, that the 5th harmonic is in a central position. An indication of this is the fact that in harmonics the three major chords f-a-c, c-e-g, and g-b-d each represent fundamental tone sequences with the frequency ratio 4:5:6 (Feynman et al., 1966). The harmonics 4
w and 6w are exactly represented in the maximum entropy spectrum, too, and in addition the peaks at 12w , 15w , and 18w , which are multiples of 4w , 5w , and 6w . Figure 3 corroborates this result. It shows the MEM spectrum of the rotation data of the single JU-CM-CS cycle 1970.02 to 1974.48. The spectrum is based on 63 data points and 25 filter coefficients. The! frequency / is measured in millicycles per sampling interval of a Carringtonl rotation. The ordinate axis indicates the relative power P of the respective!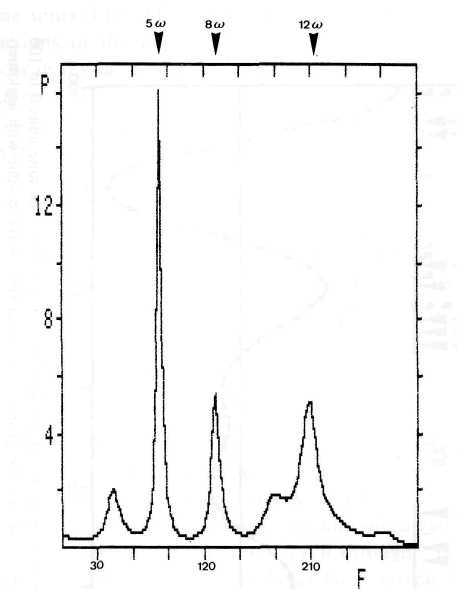
Fig. 3. Maximum entropy spectrum of the running variance of Mount Wilson rotation data covering the JU-CM-CS quasicycle 1970.02 to 1974.48.
The prominent peaks point to 5
w and the double of 4w and 6w. frequencies. The harmonic 5w again stands out from the other frequencies, and the prominent peaks 5w and 12w are multiples of 4 w and 6w. In the single cycle 1970.02 to 1974.48 the period of the prominent harmonic 5w is 0.89 years. It is not commensurable with the 1 -year period of the fifth harmonic of the mean interval of three consecutive cycles mentioned above. The respective 5o>-periods of the two other single cycles 1967.8 to 1970 and 1974.5 to 1982.8 are 0.44 years and 1.66 years. Thus, the correspondence of the 1-year period of the fifth harmonic of the mean interval of the three acycles involved and the earth's orbital motion around the Sun seems to be a fortuitous fit.7. IOT Wave Pattern Related to Solar Cosmic Ray Events and Bursts >= X4
These results beg for an experimental synthesis of the harmonics 4
w , 5w , and 6w such that corresponding cosine waves are superimposed to form a resultant wave with the frequency w of the fundamental which is the respective JU-CM-CS cycle. The amplitudes of the single cosine waves were chosen to form the inverse ratio 6:5:4. Figure 4 shows the prototypal pattern of the composite wave.
Fig. 4. Prototypal pattern of a composite wave formed by the superposition of harmonics with the frequency ratio 4:5:6. The time units 0 to 100 represent normalized centesimal fractions of JU-CM-CS cycles of any length. The positive phases of the composite wave concur with agglomerations of solar cosmic ray events (P) observed 1942 to 1969 and flare generated X-ray bursts > X4 (marked by pointers) registered through 1985.
The time units 0 to 100 on the axis of abscissae represent normalized centesimal fractions of the period of JU-CM-CS cycles of any length. Thus events that occur in the same phase of cycles of different periods coincide in the prototypal pattern. Phase coincidence becomes immediately apparent.
Solar cosmic ray events, that are always accompanied by energetic X-ray bursts, have been observed since 1942. As they are rare events, there were only 21 cases listed through 1969 (Smith and Smith, 1963; Sakurai, 1974; Blizard, 1969). The epochs of these highly energetic proton events are marked in Figure 4 by P. 17 events out of 21 match positive phases of the composite wave that are marked on top by lines bounded by bars. The two phases that show a less steep descent, cycle fractions 20/100 to 26/100 and 50/100 to 55/100, seem to show a prolonged effect; thus three negative percentiles were added to the respective positive phases as indicated by those lines bounded by bars. A Pearson-test of the distribution of the 21 solar cosmic ray events yields x2 = 8.1 for 1 deg of freedom (df); P < 0.005.
Since 1970 X-ray bursts were continually observed by satellite instrumentation (Solrad/SMS/GOES) and listed in Solar-Geophysical Data published by the National Oceanic and Atmospheric Administration (NOAA), Boulder. The intensity of X-ray bursts in the range 1 to 8 A is measured by the classes C, M, and X. The lower classes C and M comprise decadic subcategories. The top class X (>=10-1 erg cm-2 s-1) is open beyond X9. 1970 through 1985. 46 flare gener ated X-ray bursts > X4 were recorded in Solar Geophysical Data and in Ursigrams of IUWDS. The epochs of these bursts are indicated in Figure 4 by pointers. 41 fit the defined positive phases of the composite wave; only 5 hit negative phases. A Pearson-test yields x2 (d/= 1) = 28.2; P—l.l x 10~7. When only very energetic X-ray bursts are selected, all of 18 observed events >= X7 fit the positive phases. A combination of cosmic ray events and bursts >= X4 yields a sample of 67 events, 58 of which meet positive phases. A Pearson-test gives x2 (df=l) = 35.8;P = 7x 10⁻¹⁰.
8. Forecast of Energetic Solar Events
This highly significant result was tested by predictions. According to a long range forecast issued January 15, 1983, during respective positive phases of the JU-CM-CS cycle 1982.83 to 1990.3, 15 Jan.-l April 1983, 1 Jan. 1984-1 Febr. 1985, and 1 Jan. 1986-9 Jan. 1987, the incidence and weight of energetic X-ray bursts, proton flares and corresponding solar terrestrial interaction were expected to reach 2.5 times that of less active intervening periods. As yet, all events >= X4, the most energetic proton flares, and severe magnetic disturbances fit the predicted phases of enhanced activity: 3 Febr. 1983: X4; 4 Febr. 1983: proton event 340 particles (cm2 ster s)-1 at 10 MeV; 5 Febr. 1983: Ak= 110; 16 Febr. 1984: proton event 660 particles; 24 April 1984: X13; 26 April 1984: proton event 2500 particles; 19 May 1984: X4; 20 May 1984: X10; 11 Nov. 1984: Ak = 87; 22 Jan. 1985: X4; 4 Febr. 1986: X4; 8 Febr. 1986: Ak = 230. ,. Another forecast was based on the JU-CM-CS event 1982.83. X-ray bursts > X9 are rare events. Since 1970 only two such events had been observed when, according to a forecast published January 15, 1982, events > X9 were to be expected 15 January 1982 to 14 January 1983. Highest probability was assigned to the period from the end of September to the middle of December 1982, and second highest probability to the period from 29 April to 24 June, especially 29 April to 5 May, and 22 May to 9 June 1982. X-ray bursts XI2, X13, and X10 were observed on 6 June, 15 December, and 17 December 1982. These forecasts were checked by the Space Environment Services Center, Boulder, and the astronomers Gleissberg, Pfleiderer, and Woehl.
9. Unilateral Distribution of Solar Flares Related to IOT
The distribution of flares on the Sun also seems to be related to IOT initiated by JU-CM-CS constellations. In the Sun's motion about CM there is perpetual change between the Sun's approaching CM and receding from it. Difference forces acting on the Sun's plasma are alternately dominated by centrifugal force and gravitation while there is continual change in the strength of these forces. It is known from experiments that plasma, exposed to centrifugal force or gravitation, shows convection. This all the more as plasma is very sensitive to magneto-hydrodynamic instabilities and turbulence (Frank-Kamenetskii, 1972; Kadom-tsev, 1965). Thus, the continuous change in the strength of acting difference forces and especially abrupt reversals of the direction of respective vectors may give rise to weak but long-lasting large-scale flow that could supersede or modulate short-term plasma currents caused by the Sun's differential rotation on its axis. Such flow should follow the current direction of the vector of difference forces, i.e. away from CM when centrifugal force dominates, and pointing to CM when gravitation prevails in the Sun's swing about CM. If there were really corresponding flow, it should become apparent in visible features of the Sun's atmosphere.
Actually, the distribution of optical flares follows the expected pattern. Figure 5 presents the observed effect. It shows the Sun's orbit around CM for the years 1951 to 1971. Points in the orbit indicate the position of the Sun's center on July 1st of the respective years. In 1951 there was a strong positive impulse of the torque initiated by JU-CM-CSc. Centrifugal force was dominant. In 1959 a strong negative impulse of the torque occurred initiated by JU-CM-CSg. Gravitation became dominant in the Sun's motion. The Sun approached CM. Optical flares showed a corresponding unilateral distribution (Landscheidt, 1976; 1986a). From 1951 to 1956 flares occurred much more frequently on that side of the Sun which pointed away from CM. This preferred direction is indicated by the hatched solar hemisphere on top of Figure 5. This sketch of the geometry does not give the Sun's proper dimension. The circle around CM marks the size of the Sun's body.
Fig. 5. Sketch of the geometry of a unilateral distribution of solar flares following the JU-CM-CSc and JU-CM-CSg events in 1951 and 1959.
The unilateral aggregation of flare positions is irrespective of the Sun's rotation on its axis. In spite of this rotation, from 1951 to 1956 flares kept emerging more frequently on the side far from CM. This result could be derived from heliographic coordinates of flares by relating them to the celestial coordinates of the relative positions of Sun and earth at the time of the chromospheric eruption (Landscheidt, 1976). Out of 1318 optical flares observed from 1951 to 1956, 886 occurred on the side far from CM, and only 432 on the Sun's side pointing toward CM. A Pearson-test yields x2(df = 1) = 156; (P <<< 0.00001). The distribution in single years showed homogeneous results. This continuous effect related to the strong impulse of the torque in 1951 cannot be explained as an artifact of observation. The years before 1951 showed a stochastic distribution, and from 1957 to 1959 the unilateral pattern disappeared completely (x2(df = 1) = 2).
The strong negative impulse of the torque initiated by JU-CM-CSg 1959 changed the distribution again. Consistently, more flares appeared on that side of the Sun which pointed toward CM in approaching it. Out of 1247 flares observed from 1960 through 1963, 761 lit up on the side next to CM, and only 461 on the opposite side. A Pearson-test yields x2(d/= 1) = 61; (P << 0.00001). The effect was not quite as long-lasting as after 1951, and not as strong. But this was in proportion to the different strength of the two impulses involved. In 1964 the stochastic distribution was restored. A further negative IOT, even stronger than that in 1959, was to be expected in form of JU-CM-CSg in 1982.83. Thus, it was consistent to forecast a flare pattern similar to that 1960 through 1963 for 1983 and the following years (Landscheidt, 1980). The flare distribution in 1983 fit this prediction. Flares lit up twice as frequent on the Sun's side directed to CM. This development continued in 1984.
The strength of the impulses of the torque involved turned out to be a decisive criterion. As yet, only the strong impulses in 1951, 1959, and 1982, that transgressed a special quantitative threshold, released a unilateral distribution in optical flares. The weaker impulse in 1942 and three weaker impulses between 1959 and 1982 had no unilateral effect. The next impulse of the torque initiated by JU-CM-CSc in 1990.3 will again transcend the quantitative threshold. Similar effects as in 1951 to 1956 are to be expected, but probably a bit weaker and not as long-lasting.
10. Correspondence between Peaks in Geomagnetic Activity and IOT Epochs
Geomagnetic disturbances are a highly developed field of research in solar-terrestrial relations. They may be related to weather, as has been shown in Section 1. Minor geomagnetic disturbances are caused by enhanced solar X-ray output. This solar flare effect, frequently referred to as a crochet, has already been mentioned. Most major disturbances, called magnetic storms, are caused by energetic solar eruptions. Especially proton flares, that are accompanied by strong X-ray bursts, release severe magnetic disturbances. There is a host of indices to measure magnetic disturbances. Such indices show a good general correlation with the sunspot number R. But in detail the data do not correspond as well. This can be seen in Figure 6 that presents the long-term variation of geomagnetic activity as measured by the aa index (after Mayod, 1980). It is based on an aa series published by Mayaud (1973; Mayaud and Romana, 1977) the quantitative homogeneity of which is acknowledged to be good. The yearly values covering the period 1868 to 1975 were derived from running monthly means. Additional data up to 1984 were taken from Solar-Geophysical Data published by the National Oceanic and Atmospheric Administration (NOAA), Boulder.
Short pointers at the bottom of Figure 6 mark the epochs of 11 -year sunspot maxima. They do not match the highest peaks in the plot and sometimes even
coincide with minima, as in 1883.9 and 1979.96. The arrows pointing down^ wards, however, fit the most prominent peaks in geomagnetic activity in nearly all cases. They mark epochs of those JU-CM-CS events that occurred 1868 to 1984. There were only two striking exceptions to the fit: the JU-CM-CS events in 1901.77 and 1912.05.
But they coincided with deep protracted sunspot minima; there was no potential of activity to draw on. No other such coincidence occurred in the period 1868 to 1984. As can be derived from Figure 6, the deficit in JU-CM-CS effects seems to have brought down the level of geomagnetic activity. In 1967.8 and 1970.02 the related peaks were low. This could be due to a disturbance of the rhythm in the pattern. The interval between the two events was unusually short, only 2.22 years. A Pearson-test of the goodness of fit of outstanding aa peaks, going beyond defined thresholds, and JU-CM-CS epochs yields #2(d/= 1)= 17.1; P = 0.00004. The strong enhancement of geomagnetic activity in 1982 was forecast with regard to these results in January 1982. The prediction was controlled by the astronomers Gleissberg, Pfleiderer and Woehl. A new peak in geomagnetic activity is to be expected around the JU-CM-CS event 1990.3. Its height depends on the activity potential of 11-year cycle No. 22 which is expected to be weak (Gregg, 1984; Landscheidt, 1983).
The data in Figure 7 (Hedeman et al., 1986) corroborate the connection. The histogram on top of Figure 7 indicates the number of days each year with C9 >= 5. C9 is a classical index of geomagnetic activity with 10 steps from 0 to 10 (Mayaud, 1980). The arrows, added to Hedeman's plot, designate the epochs of JU-CM-CS events. They match in most cases high peaks in the incidence of C9 >= 5. As to exceptions, explanations have already been given. The curve at the bottom of Figure 7 shows the course of sunspot cycles No. 12 to 21. Visual comparison yields poor congruence of sunspot maxima with peaks in geomagnetic activity. This is conspicuous around the maximum No. 21.
11. IOT Events and Circulation
As mentioned in Section 1, geomagnetic storms and other disturbances of the magnetosphere may have an effect on weather. Schuurmans (1979), e.g., has developed a tentative model that links flare generated changes in the earth's magnetosphere to effects in the troposphere. As the percentage of flare generated magnetic storms improves dramatically if only X class events are considered, that show a connection to IOT, it suggests itself to look for relations between IOT epochs and Schuurmans' results. He has pointed to the possibility that flare effects could trigger blocking circulations which can control the atmosphere for several weeks though the actual intervention was only effective for some hours. Figure 8, published by Schuurmans (1979), shows the yearly numbers of meridional and blocking type circulations in the European Atlantic area for the period 1881 to 1975. There are different quantitative levels indicated by dashed lines. According to Schuurmans this difference is statistically significant.
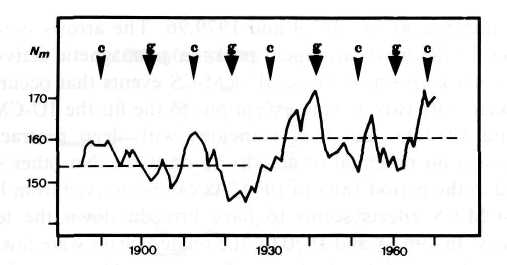
Fig. 8. Yearly number Nm meridional and blocking type circulations in the European Atlantic area for 1881 to 1975 (after Schuurmans, 1979), and epochs of events JU-CM-CSc and JU-CM-CSg.
Pointers on top of Figure 8 designate the epochs of JU-CM-CS events that are correlated with peaks and troughs in the time series. The types c and g of JU-CM-CS constellations, indicated in Figure 8 by pointers and corresponding letters, seem to have left different marks in the data. The number of meridional and blocking type circulations Nm rises to a higher level after 1930. Up to 1930 JU-CM-CSs concurs with a high level, and JU-CM-CSg matches troughs in the time series. In 1930 an opposition of phase became apparent. JU-CM-CSg in 1942 coincided with a peak and JU-CM-CSc in 1959 with a trough. Then another phase shift occurred, and the following JU-CM-CS events again showed the relation that prevailed 1881 to 1930. It is known in physics and geophysics that a steep slope, as observed in 1930, may correspond to the onset of a new wave mode (Bath, 1974).
12. Correlation of IOT Epochs with Peaks of Ozone Concentration ;
Skylab's solar observing program has provided direct evidence that ultraviolet radiation increases as dramatically as X-rays during energetic flares. Detailed ultraviolet spectra of solar flares, showing about 5000 spectral lines, include the wavelengths above 1700 A (Eddy, 1979) that are involved in the production of ozone in the Earth's atmosphere. There is an abundance of papers speculating about the response of ozone to solar activity and connections with tropospheric climate (e.g. Fairbridge and Hillaire-Marcel, 1977; Keating, 1981; Bates, 1981; Chamberlain, 1982). The physical and photochemical problems involved are rather complex. Ionizing radiation contributes to the formation of NO* that causes ozone reduction. According to Nimbus 4 observations of the effects of the proton flare on 4 August 1972, such catalytic reduction reached 16% in the ozone concentration above 4 mbar and above latitude 70° N (Heath, Krueger, and Crutzen, 1977).
But Crutzen and Solomon (1980) could show that in the mesosphere at a height of 80 km there must have been a strong increase in ozone concentration, as the initial catalytic ozone reduction by HOX, going along with a drastical decrease in water vapour concentration, gave rise to abundant formation of H2, favourable to ozone production. Since 1980 Reiter (1983) has launched series of radiosonde flights immediately after energetic solar flares that revealed lowering of the tropopause, intrusion of warm stratospheric air from higher levels, formation of a sharply defined secondary ozone maximum immediately above the tropopause, perforation of the tropopause with voluminous intrusion of stratospheric air masses, emerging of jet streams, and change from zonal to meridional circulation. This development, involving ozone profile, is observed to occur within a few days after the energetic flares signaled by a Forbush decrease.
Intriguingly, JU-CM-CS events also seem to be related to deviations in ozone concentration. U.S. and Canadian records of such data extend back only to about 1960. But continuous ozone monitoring at Arosa in the Swiss Alps since 1926 provides a rare long-term record of ozone levels. Figure 9, adapted from Duetsch (1974), presents the deviation of annual mean values from the 50-year mean of 337 Dobson units. A change of about 17 Dobson units corresponds to a 5% change in ozone concentration. The epochs of JU-CM-CS
constellations are marked by triangles. As to the events 1967.8 and 1970? That are only separated by an interval of 2.2 years, the mean of both epochs is indi cated. The JU-CM-CS epochs fit the strongest ozone deviations. In addition the phases n/2 and n radians, that were conspicuous in the Sun's rotation data, concur with secondary peaks. Small arrow heads in Figure 9 point to these phases.
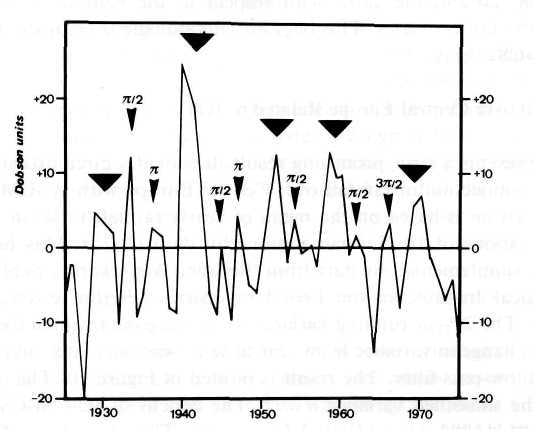
Fig.9. Arosa record of ozone levels since 1926. The curve (after Deutsch, 1974) plots the deviation of annual mean values from the 50-year mean of 337 Dobson units. Triangles mark epochs of JU-CM-CS events. Arrow heads point to phases p /2, p and 3p /2 radians in JU-CM-CS cycles.
13. IOT and Climate
There are indications that IOT, initiated by JU-CM-CS constellations, are likewise connected with temperature and rainfall. Mitchell (1983) investigated chronologies of annual average temperatures of the Northern Hemisphere, 1883-1978, as independently reconstructed by three groups of authors. In the variance spectra of residuals, derived from the time series mentioned above after removal of volcanic and CO2 effects, the strongest peak had a period of about 8 years and was accompanied by a prominent peak near 4 years pointing to a possible second harmonic. Mitchell thought that the strong 8 year peak had no counterpart in solar behavior and presumably came from other sources, possibly of spurious origin. The mean interval of JU-CM-CS events in the investigated period 1883-1978 was 8.2 years. With respect to the results presented hitherto, this could be the connection with solar activity Mitchell was looking for.
Currie (1981) has found an 18.6-year wavelength feature in the drought variation in the western United States. Stockton, Mitchell, and Meko (1983) confirmed this in their reappraisal of the 22-year drought cycle they had related to the Hale sunspot cycle. But they maintain that the 22-year rhythm is a robust and persistent feature of the records since AD 1600. Stockton et al. (1983) tentatively confirm the suggestion by Bell (1981) that there may be both lunar-related, as held by Currie, and solar-related components, as shown by Stockton et al. (1983). Possibly, the case is still more complex. The mean interval of JU-CM-CSc and JU-CM-CSg events each since 1600 is 18.6 years. Interestingly, there was often phase coincidence of the period of revolution of the node in the moon's orbit around the earth with respect to the ecliptic with JU-CM-CS periods in the last centuries. This begs for climatologic investigations that allow for JU-CM-CS effects.
14. Rainfall over Central Europe Related to IOT
Figure 10 presents a first, promising result. It provides circumstantial evidence of a strong connection of rainfall over Central Europe with JU-CM-CS epochs. The investigation is based on the mean of yearly rainfall totals in mm derived from observations of 14 German stations by Baur (1975). This homogeneous time series, supplemented by data from 'Berliner Wetterkarte', published by the Meteorological Institute of the Free University of Berlin, covers the period 1851-1983. The 2-year running variance s2 of these data, which focusses attention on the change in variance from year to year, was calculated and subjected to a Gaussian low-pass filter. The result is plotted in Figure 10. The ordinate axis measures the smoothed variance u = s2. The epochs of JU-CM-CS events that occurred 1851-1983 are indicated by arrows. The respective phases in the middle of two consecutive epochs are designated by open circles. It is obvious
Fig. 10. Smoothed running variance of yearly rainfall totals (mm) derived from observations of 14 German stations by Baur. The time series covers the period 1851-1983. Arrows mark JU-CM-CS epochs. Open circles designate phases n radians of respective JU-CM-CS cycles.
that the JU-CM-CS epochs altogether show a good correlation with peaks in the plot, whereas the phases n radians coincide with minima.
This connection is corroborated by a detailed statistical analysis of the unsmoothed 2-year running variance of the rainfall data presented in Figure 11. The JU-CM-CS epochs are marked by triangles and the phases n radians by open circles. The statistical analysis evaluates the significance of the difference between means of the running variance of two groups: Group 1 composed of the variance of years coinciding with JU-CM-CS epochs and of the respective preceding and following year; Group 2 comprising the variance of the years that concur with phases n radians and the respective preceding and following year. All distributions involved are Gaussian and free from Markov type persistence. As the variance in the test groups shows a significant difference, the Fisher-Behrens formula had to be applied in the f-Test.
Group 1 yielded: number of data points n1 = 46, mean x1 = 13.46, and standard deviation s1 = 15.25. The corresponding values in Group 2 were: n2 = 48, x2 = 3.48 and s2 = 7.65. The corresponding test value t (df = 67) = 3.98. Considering that the variance generates positive values only and Group 1 is known to have a higher mean than Group 2, the rules valid for single-sided distributions apply: P< 0.0002. The null hypothesis of no significant difference between the means involved can be rejected at a high level of significance.
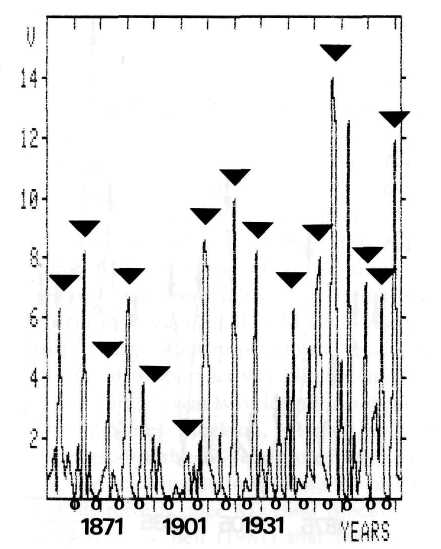
Fig. 11. Unsmoothed values of the data presented in Figure 10. JU-CM-CS epochs are indicated by black triangles. Open circles mark the middle between such epochs (phases n radians).
The same procedure applied to the same data set, but based on a 3-year running variance, gives the results: n1 = 46; x1 = 12.19; s1 = 8.76. n2 = 48; x2 = 4.38; s2 = 6.8. t (df = 87) = 4.82; P < 0.00003. 4-year and higher running variance shows deteriorating results. Nonparametric tests including the Mann-Whitney test (z = 3.84; P < 0.0001) and the Pearson test confirm the connection.
Another approach contributes to these corroborations. The complete data set is characterized by n = 132; x = 7.5; s = 11.85. In a group that comprises only the variance data of the years of the occurrence of phases n radians, the corresponding values are n3 = 16; x3 = 1.15; s3 = 1.3. The r-test yields t (df = 147) = 5.87; P< 0.000002. This connection, relating the phase n radians in the middle between consecutive JU-CM-CS events to low variance values seems to be rather dependable. In practice this means that around phases n radians there is little contrast as to wetness and drought in consecutive years, whereas change of flood years to drought years or vice versa is frequent around JU-CM-CS events.
15. IOT Connection of Rainfall over England/Wales and Eastern United States
A replication was made by means of yearly rainfall averages for England and Wales 1850-1976 (Lamb, 1977). The same procedure, based on 2-year running variance data, yielded: n1 = 47; x1 =2.67; s1 =3.55. n2 = 45; x2 = 1.06; s2 = 1.62. t (df = 66) = 2.83; P < 0.004. The null hypothesis of no real difference between the means of the two groups is disproved again.
When the groups of three years each around the epochs in question are replaced by groups allotted to a sine wave that comprises all data available, the tests continue to indicate highly significant results. The JU-CM-CS epoch is assigned to the sine wave such that it coincides with the phase p /2 radians at the crest, whereas the epoch in the middle between JU-CM-CS events concurs with the phase 3p /2 radians at the trough. All years matching positive phases of the sine wave including the phases 0 and p radians fall in Group 1, and all years coinciding with negative phases are assigned to Group 2. As to the rainfall over Germany this new procedure, when based on 2-year running variance, yields t (df = 109) = 3.9. The corresponding probability P < 0.0002 justifies the dismission of the null hypothesis at a high level of significance. The rainfall averages for England and Wales, subjected to the new procedure, give t (df = 104) = 3; P < 0.002. Another replication makes use of the yearly total rainfall (mm) in the eastern United States, reduced to Philadelphia equivalent values (Lamb, 1977; Landsberg et ah, 1968) covering the period 1850 -1967. The sine wave procedure gives: n1 = 66; x1 =1.72; s1 = 1.91. n2 = 51; x2 = 1.01; s2 = 1-14. t (df = 110) = 2.48; P = 0.009. The null hypothesis can be rejected. This points to a real difference of the two groups as to rainfall in the northern hemisphere, but so far only as to mid-latitudes.
16. Indian Monsoon Season Rainfall and IOT
The next replication makes use of data from the equatorial region: yearly monsoon season (June-September) rainfall (mm) at Bombay 1850-1960 (Lamb, 1977). The difference of both groups is still evident, but the sine wave procedure reveals a phase shift. The effect begins and ends n/2 radians earlier. If allowance is made for this shift, the results are: n1 = 65; x1 = 2.54; s1 = 3.09. n2 = 45; x2=1.45; s2 = 2. t (df = 109) = 2.24; P = 0.014. The phaseshift by n/2 radians is no ephemeral feature. It is confirmed by the analysis of All-India summer monsoon (June to September) rainfall (mm) for the period 1871-1978. This time series was already object of a thorough investigation published in this journal (Mooley and Parthasarathy, 1984). Sine wave processing yields: n1 = 68; x1 = 9.84; s, = 13.4. n2 = 44; x2 = 4.88; s2 = 6.47. t (df = 104) = 2.62; P = 0.005. This again is a dismission of the null hypothesis at a high level of significance. Therefore, a two-phase system with relation to the geographic latitude seems to be a promising approach.
17. Icebergs and IOT
The JU-CM-CS effect seems to have left its mark still in other climatic features. The longest records of ice in the western North Atlantic are derived from the yearly counts of the number of icebergs which pass south of latitude 48° N to affect the shipping lanes. These counts are quoted in terms of the Smith-index which provides a scale from -5 to +5. The time series (Lamb, 1977) covers the period 1880 to 1976. As the counts refer to higher latitudes, the position of the crucial epochs in the sine wave should show no phase shift. This comes out to be true. The test of both groups, processed in the same way as the German, England and Wales, and U.S. rainfall data, yields the following result: n, = 56; x, = 5.32; s, =7.17. n2 = 40; x2 = 2.68; s2 = 3.37. t (df = 84) = 2.41; P — 0.009. The rejection of the null hypothesis is again justified at a high level of significance.
18. Temperature Connection with IOT
Temperature opens a further field of replication. Baur (1975) established a time series of yearly temperature averages (°C) based on the respective means of the stations Utrecht-De Bilt, Potsdam, Basel, and Wien. With extensions taken from "Berliner Wetterkarte" the series covers the period 1851-1983. The sine wave method, as applied to the Central European rainfall data, gives the following values: n,=77; x, = 0.463; s, =0.619. n2 = 55; x2 = 0.217; s2 = 03. t (df = 118) = 3; P < 0.002. Again a highly significant result. Yearly mean temperatures CO in central England (Manley, 1974; Lamb, 1977) 1851-1976 offer occasion for another replication. The result is significant, but less striking: n1 = 69; x1 = 0.293; s1 = 0.382. n2 = 56; x2 = 0.196; s2 = 0.274. t (df= 123)= 1.65; P = 0.05. In this connection phases n radians point to series of years showing little contrast in temperature, whereas IOT epochs are characterized by sequences of alternately hot and cold years. An analysis of annual average temperatures of the Northern Hemisphere (Jones et ai, 1982; Groveman et al., 1979) 1850-1978 yielded no significant difference of the means of groups formed with respect to epochs of JU-CM-CS events. This may be due to phase differences in different geographical latitudes that cancel out.
The first results of this interdisciplinary approach certainly are in need of further corroboration by replications based on new data that cover long time series and various geographical regions. They should, however, be intriguing enough to induce scientists competent in the different fields involved to follow the trace outlined in this study. Hopefully, this could lead, besides predictions of X-ray flares and geomagnetic activity, to progress in forecasting climatic variability. Thus the end of Sahelian drought in 1985 was forecast in a 1983 publication (Landscheidt, 1983; Faure and Gac, 1981) based on impulses of the torque in the Sun's motion about CM.
References
Balthasar, H. and Woehl, H.: 1980, 'Differential Rotation and Meridional Motions of Sunspots in the Years 1940-1968', Astron. Astrophys. 92, 111-116.
Balthasar, H., Vazquez, M., and Woehl, H.: 1986, 'Differential Rotation of Sunspot Groups in the Period from 1874 through 1976 and Changes of the Rotation Velocity within the Solar Cycle', Astron. Astrophys. 155, 87-98.
Bates, J. R.: 1981, 'A Dynamical Mechanism through which Variations in Solar Ultraviolet Radiation Can Infuence Tropospheric Climate', Sol. Phys. 74, 399-415.
Bath, M.: 1974, Spectral Analysis in Geophysics, Elsevier, Amsterdam.
Baur, F.: 1975, 'Abweichungen der Monatsmittel der Temperatur Mitteleuropas und des Nieder-schlags in Deutschland', Beilage zur Berliner Wetterkarte des Inst. f. Meteorologie der FU Berlin vom 24.6.1975.
Bell, P. R.: 1981, 'Variations of the Solar Constant', NASA Conference Publication 2191.
Beynon, W. J. G. and Winstanley, E. H.: 1969, 'Geomagnetic Disturbance and the Troposphere', Nature 222, 1262-1263.
Blizard, J. B.: 1969, 'Long Range Solar Flare Prediction', NASA Report, Contract NAS8-21436.
Bossolasco, M., Dagnino, I., Elena, A., and Flocchioni, G.: 1972, 'Solar Flare Control of Thunderstorm Activity', Instituto Universitario Navale di Napoli.
Bucha, V.: 1983, 'Direct Relations between Solar Activity and Atmospheric Circulation, its Effect on Changes of Weather and Climate', Studia geoph. et geod. 27, 19-45.
Burg, J. P.: 1968, 'A New Analysis Technique for Time Series Data', paper presented at NATO Advanced Institute of Signal Processing, Enschede.
Burg, J. P.: 1972, 'The Relationship between Maximum Entropy and Maximum Likelihood Spectra', Geophysics 37, 375-376.
Burg, J. P.: 1975, 'Maximum Entropy Analysis', Ph.D. thesis, Stanford University, Palo Alto.
Chamberlain, J. W.: 1982, 'The Influence of Solar Ultraviolet Variability on Climate', Planet. Space Sci. 30, 147-150.
Chistyakov, V. F.: 1976, 'The Rapid Oscillations of the Solar Rotation', Bull. Astron. Inst. Czechoslovakia 27, 84-91.
Clark, D. H., Yallop, B. D., Richard, S., and Emerson, B.: 1979, 'Differential Solar Rotation Depends on Solar Activity', Nature 280, 299-300.
Cobb, W. E.: 1967, 'Evidence of Solar Influence on the Atmospheric Electric Elements at Mauna Loa Observatory', Mon. Weather Rev. 95, 905-911.
Crutzen, P. J. and Solomon, S.: 1980, 'Response of Mesospheric Ozone to Particle Precipitation', Planet. Space Sci. 28, 1147.
Currie, R. G.: 1981, 'Evidence for 18.6 year Mn Signal in Temperature and Drought Conditions in North America since AD 1800', /. Geophys. Res. 8, 11055-11064.
Dicke, R. H.: 1964, 'The Sun's Rotation and Relativity', Nature 202, 432-435.
Duetsch, H. U.: 1974, 'The Ozone Distribution in the Atmosphere', Can. J. Chem. 52, 1491-1504 (Figure 9 was adapted from a plot by H. U. Duetsch, Eidgenossische Technische Hochschule Zurich, in Rowland, F. S.: 1978, 'Stratospheric Ozone: Earth's Fragile Shield', 1979 Yearbook of Science and the Future, Encyclopaedia Britannica, University of Chicago).
Eddy, J. A., Gilman, P. A., and Trotter, D. E.: 1977, 'Anomalous Solar Rotation in the Early 17th Century', Science 198, 824-829.
Eddy, J. A.: 1977, 'The Case of the Missing Sunspots', Scient. American 236, 80-92.
Eddy, J. A.: 1979, 'A New Sun. The Solar Results from Skylab', NASA, Washington, D.C.
Eddy, J. A., ed.: 1982, 'Solar Variability, Weather, and Climate', National Academy Press, Washington, D.C.
EOS, Transactions, American Geophysical Union: 1985,441.
EOS, Transactions, American Geophysical Union: 1987, 668.
Fairbridge, R. W. and Hillaire-Marcel, C: 1977, 'An 8000-Year Paleoclimatic Record of the Double-Hale 45-Year Solar Cycle', Nature 268, 413-416.
Faure, H. and Gac, J. Y: 1981, 'Will the Sahelian Drought End in 1985?', Nature 291, 475-478.
Feynman, R. P., Leighton, R. B., and Sands, M.: 1966, 'The Feynman Lectures on Physics', Vol. 1, Addison-Wesley, Reading.
Frank-Kamenetskii, D. A.: 1972, 'Plasma: The Fourth State of Matter', Plenum Press, New York.
Gelopolsky, A.: 1933, Z. Astrophys. 7, 357.
Gilman, P. A. and Howard, R.: 1984, 'Variations in Solar Rotation with the Sunspot Cycle', Astrophys-J. 283, 385-391.
Godoli, G. and Mazzucconi, F.: 1979, 'On the Rotation Rates of Sunspot Groups', Sol. Phys. 64, 247-254.
Gosling, J. T., Asbridge, J. R., and Bame, S. J.: 1977, 'An Unusual Aspect of Solar Wind Speed Variations during Solar cycle 20', / Geophys. Res. 82, 3311-3314.
Gregg, D. P.: 1984, 'A Nonlinear Solar Cycle Model with Potential for Forecasting on a Decadal Time Scale', Sol. Phys. 90, 185-194.
Groveman, B. S. and Landsberg, H. E.: 1979, 'Reconstruction of the Northern Hemisphere Temperature: 1579-1880', Publ. No. 79 181/182, Department of Meteorology, University of Maryland.
Hale, L. C: 1979, 'Solar Modulation of Atmospheric Electrification and the Sun-Weather Relationship', Nature 278, 373.
Hale, L. C: 1983, 'Experimentally Determined Factors Influencing Electrical Coupling Mechanisms', in McCormac, B. M. Weather and Climate Responses to Solar Variations, Colorado Associated University Press, Boulder.
Heath, D. R, Krueger, A. J., and Crutzen, P. J.: 1977, 'Solar Proton Event: Influence on Stratospheric Ozone', Science 197, 886.
Hedeman, E. R. and Dodson-Prince, H.: 'Indications of Probable Levels of Sunspot Numbers and Geomagnetic Disturbance in Solar Cycle 22', in Simon, P. A., Heckman, G., and Shea, M. A.: 'Solar-Terrestrial Predictions: Proceedings of a Workshop at Meudon, June 18-22, 1984, National Oceanic and Atmospheric Administration, Boulder 1986, 97-98.
Howard, R.: 1975, 'The Rotation of the Sun', Scient. American 232, 106-114.
Howard, R. and LaBonte, B. J.: 1980, 'The Sun Is Observed to Be a Torsional Oscillator with a Period of 11 Years', Astrophys. J., Lett. 239, L33-L36.
Howard, R., Adkins, J. M., Boyden, T. A., Cragg, T. A., Gregory, T. S., LaBonte, B. J., Padilla, S. P., and Webster, L.: 1983, 'Solar Rotation Results at Mount Wilson', Solar Physics 83, 321-338.
Howard, R.: 1984, 'Solar Rotation', Ann. Rev. Astron. Astrophys. 22, 131-155.
Jones, P. D., Wigley, T. M. L., and Kelly, P.M.: 1982, 'Variations in Surface Air Temperatures: Part 1, Northern Hemisphere, 1881-1980', Mon. Weather Rev. 110, 59-69.
Jose, P. D.: 1965, 'Sun's Motion and Sunspots', Astron. J. 70, 193-200.
Joselyn, J. A.: 1986, 'SESC Methods for Short-Term Geomagnetic Predictions', in Simon, P. A., Heckman, and Shea, M. A.: 'Solar-Terrestrial Predictions', National Oceanic and Atmospheric Administration, Boulder 1986, 404-414.
Kadomtsev, B. B.: 1965, 'Plasma Turbulence', New York.
Keating, G. M.: 1981, 'The Response of Ozone to Solar Activity Variations: A Review', Sol. Phys. 74,321-347.
King, J. W.: 1974, 'Weather and the Earth's Magnetic Field', Nature 247, 131-134.
Lamb, H. H.: 1977, 'Climate Present, Past and Future', Vol. 2, 'Climatic History and the Future', Methuen, London.
Landscheidt, T.: 1976, 'Beziehungen zwischen der Sonnenaktivitat und dem Massenzentrum des Sonnensystems', Nachrichten der Olbers-Gesellschaft 100, 2-19.
Landscheidt, T.: 1980, 'Sakularer Tiefpunkt der Sonnenaktivitat - Ursache einer Kalteperiode urn das Jahr 2000?', Jahrb. d. Wittheit zu Bremen 24, 189-220.
Landscheidt, T.: 1981, 'Swinging Sun, 79-Year Cycle, and Climatic Change', J. Interdiscipl. Cycle Res. 12, 3-19.
Landscheidt, T.: 1983, 'Solar Oscillations, Sunspot Cycles, and Climatic Change', in B. M. McCormac, ed.: 1983, 'Weather and Climate Responses to Solar Variations', Colorado Associated University Press, Boulder, 293-308.
Landscheidt, T.: 1984, 'Cycles of Solar Flares and Weather', in Moerner, N. A. and Karlen, W. (eds.), 'Climatic Changes on a Yearly to Millenial Basis', D. Reidel Publ. Co., Dordrecht, pp. 473-481.
Landscheidt, T.: 1986a, 'Long-Range Forecast of Energetic X-Ray Bursts Based on Cycles of Flares', in Simon, P. A., Heckman, G., and Shea, M. A. (eds.), Solar-Terrestrial Predictions, National Oceanic and Atmospheric Administration, Boulder, pp. 81-89.
Solar Rotation, Impulses of the Torque in the Sun's Motion 293
Landscheidt, T: 1986b, 'Long Range Forecast of Sunspot Cycles', in Simon, P. A. Heckman, G., and Shea, M. A. (eds.), Solar- Terrestrial Predictions, National Oceanic arid Atmospheric Administration, Boulder, pp. 48-57.
Landscheidt, T.: 1987, 'Long Range Forecasts of Solar Cycles and Climate Change', in Sanders, J. E. and Rampino, M. R. (eds.), Climate: History, Periodicity, Predictability, Festschrift in honor of Rhodes W. Fairbridge, van Nostrand Reinhold, New York, pp. 421-445.
Livingston, W. and Duvall, T. L.: 1979, 'Solar Rotation: 1966-1978', Sol. Phys. 61, 219-231.
Manley, G.: 1974, 'Central England Temperatures: Monthly Means 1659 to 1973', Quart. J. Roy. Met. Soc. 100, 389-405.
Markson, R.: 1979, 'Atmospheric Electricity and the Sun-Weather Problem', in McCormac, - B. M. and Seliga, T. A., Solar-Terrestrial Influences on Weather and Climate, D. Reidel Publ. Co., Dordrecht.
Markson, R.: 1983, 'Solar Modulation of Fair-Weather and Thunderstorm Electrification and a Proposed Program to Test an Atmospheric Electrical Sun-Weather Mechanism', in McCormac, B. M. (ed.), Weather and Climate Responses to Solar Variations, Colorado Associated University Press, Boulder.
Mayaud, P. N.: 1973, 'A Hundred Year Series of Geomagnetic Data 1868-1967', 1AGA Bulletin No. 33, IUGG Publication Office, Paris.
Mayaud, P. N. and Romana, A.: 1977, 'Supplementary Geomagnetic Data 1957-1975', IAGA Bulletin No. 39, IUGG Publication Office, Paris.
Mayaud, P. N.: 1980, 'Derivation, Meaning, and Use of Geomagnetic Data', Geophysical Monograph 22, American Geophysical Union, Washington, D. C.
Mitchell, J. M.: 1983, 'Empirical Modelling of Effects of Solar Variability, Volcanic Events, and Carbon Dioxide on Global-Scale Average Temperature since A.D. 1880', in McCormac, B. M. (ed.), Weather and Climate Responses to Solar Variations, Colorado Associated University Press, Boulder.
Mooley, D. A. and Parthasarathy, B.: 1984, 'Fluctuations in All-India Summer Monsoon Rainfall During 1871-1978', Climatic Changed, 287-301.
Mustel, E. R.: 1966, 'The Influence of Solar Activity on the Troposphere in the Polar Cap Regions', Soviet Astronomy - AJ 10, 288-294.
Mustel, E. R.: 1977, 'Solar Activity and the Troposphere', Translation from Russian, Available from NTIS, Springfield, VA 22151, 25-52.
Neubauer, L.: 1983, 'The Sun-Weather Connection - Sudden Stratospheric Warmings Correlated with Sudden Commencements and Solar Proton Events', in McCormac, B. M. (ed.), Weather and Climate Responses to Solar Variations, Colorado Associated University Press, Boulder 1983,395-397.
Newell, R. E.: 1983, 'Comments on the Boulder Solar-Terrestrial Symposium', in McCormac, B. M. (ed.), Weather and Climate Responses to Solar Variations, Colorado Associated University Press, Boulder.
Perepelkin, E. J.: 1933, Z. Astrophys. 6, 121.
Prohaska, J. T. and Willett, H. C: 1983, 'Dominant Modes of Relationship between U.S. Temperature and Geomagnetic Activity', in McCormac, B. M. (ed.), Weather and Climate Responses to Solar Activity, Colorado Associated University Press, Boulder 1983, 489-494.
Recely, F. and Harvey, K. L.: 1986, 'He I 10830 Observations of Flare Generated Coronal Holes', in Simon, P. A., Heckman, G., and Shea, M. A. (eds.), Solar-Terrestrial Predictions, National Oceanic and Atmospheric Administration, Boulder, pp. 204-211.
Roberts, W. and Olson, R. H.: 1973, /. Atmos. Sci. 30, 135.
Reiter, R.: 1969, 'Solar Flares and Their Impact on Potential Gradient and Air-Earth Current Characteristics at High Mountain Stations', Pure Appl. Geophys. 72, 259-267.
Reiter, R.: 1971, 'Further Evidence for Impact of Solar Flares on Potential Gradient and Air-Earth Current Characteristics at High Mountain Stations', Pure Appl. Geophys. 86, 142-158.
Reiter, R.: 1979, 'Influences of Solar Activity on the Electrical Potential between the Ionosphere and the Earth', in McCormac, B. M. and Seliga, T. S. (eds.), Solar- Terrestrial Influences on Weather and Climate, D. Reidel Publ. Co., Dordrecht.
Reiter, R.: 1983, 'Modification of the Stratospheric Ozone Profile after Acute Solar Events', in McCormac, B. M. (ed.), Weather and Climate Responses to Solar Variations, Colorado Associated University Press, Boulder. Roble, R. G.: 1983, 'Panel Discussion: the Reality of the Association between Solar Activity (Such as Flares) and Atmospheric Electrical Effects (Including Thunderstorms)', directed by W. O.
Roberts, in McCormac, B. M. (ed.), Weather and Climate Responses to Solar Variations,
Colorado Associated University Press, Boulder. Roble, R. G.: 1985, 'On Solar-Terrestrial Relationships in Atmospheric Electricity', J. Geophys.Res. 90,6000-6012.
Sakurai, K.: 1974, 'Physics of Solar Cosmic Rays', University of Tokyo Press. Sazonov, B. I.: 1965, 'On the Solar-Troposphere Relation', Astron. Zhurnal42, 653-655.
Sazonov, B. I.: 1974, 'Circulation in the Troposphere and Anomaly in the Terrestrial Magnetic Field', in Drodzdov, O. A. and Vorob'eva (eds.), General and Synoptic Climatology, Trudy, Vyp. 316, Leningrad, Glavnaja Geofiziceskaja Observatorija, 35-42. Schneider, S. H. and Mass, C: 1975, 'Volcanic Dust, Sunspots, and Temperature Trends', Science 180,741-746. Schoenwiese, C. D.: 1984, 'Northern Hemisphere Temperature Statistics and Forcing Part B: 1579-1980 AD, Arch. Met. Geoph. Biocl. Ser. B 35, 155-178. Schuurmans, C. J. E.: 1979, 'Effects of Solar Flares on the Atmospheric Circulation', in McCormac,
B. M. and Seliga, T. A. (eds.), Solar- Terrestrial Influences on Weather and Climate, D. Reidel
Publ. Co., Dordrecht. Schwenn, R. and Rosenbauer, H.: 1984, '10 Jahre Sonnenwindexperiment auf Helios 1 und 2', in
Porsche, H. (ed.), 10 Years Helios, DFVLR Oberpfaffenhofen. Sidorenkov, N. S.: 1974, 'Solar Corpuscular Fluxes and Weather on Earth', Moscow Akademija Nauk, Prirodai, 14-23.
Smith, H. J. and Smith, E. V. P.: 1963, Solar Flares, Macmillan, New York. St. John, C. E.: 1932, Trans. IAU4, 42-44. Stockton, C. W., Mitchell, J. M., and Meko, D. M.: 1983, 'A Reappraisal of the 22-Year Drought
Cycle', in McCormac, B. M. (ed.), Weather and Climate Responses to Solar Variations, Colorado
Associated University Press, Boulder. Stolov, H. L. and Shapiro, R.: 1974, 'Investigation of the Responses of the General Circulation at
700 mb to Solar Geomagnetic Disturbance', J. Geophys. Res. 79,2161-2170.
Storey, J.: 1932, Monthly Notices Roy. Astrom. Soc. 92, 737-741.
Wilcox, J. M.: 1975, 'SolarActivity and the Weather', J. Atmosph. Terr. Phys. 37, 237-256.
Glossary of Abbreviated Terms
Ac: Equatorial angular sidereal solar rotation rate corrected for scattered light and averaged over respective Carrington rotations.
c-events: See JU-CM-CSc.
CM: Center of mass of the solar system.
CS: Center of the Sun.
AL: Change of angular momentum L in the Sun's orbital motion about CM caused by an impulse of the torque (IOT). This change is measured by the time integral of the torque
![]()
df: Degrees of freedom.
g-events: See JU-CM-CSg.
IOT: Impulse of the torque in the Sun's irregular orbital motion about the center of mass
of the solar system CM. The intensity of IOT is measured by the change in angular momentum AL effected by the impulse.
JU-CM-CS: Solar system constellation that is formed when the center of mass CM, the Sun's center CS and the giant planet Jupiter (JU) are in line. JU-CM-CS events initiate impulses of the torque IOT in the Sun's irregular revolution about CM.
JU-CM-CSc: JU-CM-CS event that is accompanied with a sharp increase in orbital angular momentum and centrifugal motion of the Sun away from CM.
Solar Rotation, Impulses of the Torque in the Sun's Motion 295
JU-CM-CSg: JU-CM-CS event that goes along with a steep decrease in orbital angular momentum L and centripetal motion of the Sun toward CM due to prevailing gravitation.
L: Angular momentum of the Sun's orbital motion around CM.
T: Torque, the varying 'rotary force' applied to the Sun in its orbital motion about CM
that is equal to the time rate of change of the angular momentum L.
v: Running variance: the smoothing technique of running means over two or more con-
secutive readings is applied to variance, the square of the standard deviation.
Published on http://bourabai.narod.ru/ according permission of Frau Christiane Landscheidt