Solar-Terrestrial Cycles
Relationship Between Rainfall in the Northern Hemisphere and
Impulses of the Torque in the Sun's Motion
by Theodor Landscheidt
The analysis of major change in the angular momentum of the sun's irregular motion about the barycenter of the solar system, represented by extrema in the running variance of impulses of the torque (IOT), discloses a connection with both extrema in the Gleissberg cycle of secular sunspot activity and maxima in the thickness of varves from Lake Saki, Crimea. This significant relationship can be traced back to the 7th century, further inquiries link the running variance in IOT to rainfall over central Europe, England, Wales, eastern United States, and India, as well as to temperature in Europe. This significant correlation covers more than 130 years.
Theodor Landscheidt was director of the Schroeter Institute for Research in Cycles of Solar Activity, Belle Cote, Nova Scotia, Canada. This paper was presented at the Conference on the Climate Impact of Solar Activity, held at NASA's Goddard Space Flight Center in Greenbelt, Maryland, April 24-27, 1990.
There has been permanent controversy over whether or not the sun's varying activity influences weather on earth. Simple relationships discovered in the 1870s and the following decades vanished when examined more critically, or faded in the light of longer records. Furthermore, such ephemeral relationships were limited to special regions and did not cover larger areas subjected to the same or a similar climate. Yet the quest persists.
In 1987, Labitzke (1987) reported that midwinter warmings in the U.S. and Western Europe are well correlated with the 11-year sunspot cycle over the past 40 years, provided the switch in direction of stratospheric winds (QBO) is taken into account. It has been objected that this connection, covering only some decades, could be explained by internal decadal variations in the atmosphere that happen to be in phase with sunspots for some cycles, but which show no actual physical relation (Geller 1989).
This kind of criticism does not apply to the results presented here, which cover more than 130 years of rainfall and temperature data in different parts of the Northern Hemisphere and 12 centuries of Lake Saki varve data. The solidly significant correlation of these data with impulses of the torque in the sun's motion about the center of mass (CM) of the solar system cannot be explained by a complete chain of cause and effect. An acknowledged theory of solar activity does not yet exist, and the atmosphere's response to solar activity remains poorly understood.
It is shown, however, that special phases and cycles in the sun's motion, accessible to computation, show a strong relationship both with the sun's varying activity and with synchronous climatic phenomena (Landscheidt 1981,1983,1987). Earlier results based on this relationship were tested by successful long-range forecasts of energetic solar eruptions and strong geomagnetic storms (Landscheidt 1984), and by the correct prediction of the end of the Sahelian drought three years in advance (Landscheidt 1983, p. 304; Faure and Gac 1981).
Change in the Sun's Angular Momentum and Gleissberg Cycle
Satellite instruments revealed that the sun's brightness decreased by about 0.1% between the peak of sun-spot activity in 1980 and its minimum in fall 1986. Unexpectedly, the sun grew more luminous in the ascending phase of the new cycle. Analysis by Foukal and Lean (1988) indicates that the increase in bright faculae outweighs the increase in dark spots (Kuhn et al. 1988). According to calculations based on standard climate models, a dip in the solar irradiance of between 0.2% and 0.5%, acting over several decades, would have been sufficient to cause the Little Ice Age (Foukal 1990).
Thus, it is not unimaginable that the secular cycle of solar activity, covering more than eight decades, builds up a sufficient potential of climatic change by steady accumulation of excess radiation, or by continued radiation lower than average over a period of several decades (Landscheidt 1976). If this proved true, techniques based on impulses of the torque in the sun's motion (IOT) could presumably help to forecast the sun's secular behavior and the earth's climatic response.
Figure 1 shows the 36-year running variance v = s2 of impulses of the torque in the sun's motion measured by the time integral
In this equation, L represents the sun's orbital angular momentum and T the torque that drives the sun's motion about the CM. The running variance v, the moving square of the standard deviation, provides an apt representation of the change in the orbital angular momentum L within special time intervals. The epochs of minima in the secular sunspot cycle from 700 to 1600, defined by Gleissberg (1958) and Link (1978), are indicated in Figure 1 by arrows. It is obvious that all of the extrema in the running variance v in IOT coincide with the epochs of secular minima.
A connection with secular maxima emerges when the smoothed 9-year running variance of IOT is computed that shows a finer resolution. The resultant complex pattern, shown in Figure 2, conveys the impression of five-fingered hands. The middle fingers (3) and little fingers (5) point to secular sunspot minima, marked by triangles, while the other fingers indicate secular periods of intense sunspot activity, designated by arrows pointing upwards. Fingers 1 and 2 coincide with periods of protracted higher activity with an intermittent lull, whereas finger 4 is related to secular maxima concentrated on a single spell of secular activity.
This rhythmic pattern is very sensitive to disturbances. Figure 2 shows that, in the 15th century, one finger was lacking—instead of two consecutive maximum periods 1 and 2, there was only one. Remarkably, this phase anomaly coincided with the beginning of the Sporer minimum.
Figure 3 shows the effect of a different kind of disturbance that did not occur in the centuries 700 to 1600. In 1632,1811, and 1990, the sun's motion relative to the CM was retrograde, and the orbital angular momentum became negative. The epochs of these very rare events, marked by R in Figure 3, always fell on period 2, the index finger.
Special phases and cycles in the sun's motion show a strong relationship both with the sun's varying activity and with synchronous climatic phenomena.
The retrograde motion in 1632 did not change the rhythmic pattern, but it is conspicuous that the minimum period 3 coincided with the Maunder minimum. The retrogression in 1811 was related to a phase shift. Period 2 should have indicated a maximum, but coincided with the deepest secular sunspot minimum observed after the Maunder minimum. This phase inversion, the only case in 14 centuries, also affected the following periods 3 and 4. Open triangles in Figure 3 label this perturbed period; triangles pointing upwards indicate secular maxima, and those pointing downwards mark epochs of secular minima. Period 5 at the beginning of the 20th century restored the regular rhythm. The extended period of weak sunspot activity from 1880 to 1930 reflects the circumstance that period 4, irregularly connected with a secular minimum, was followed by period 5 that regularly coincides with secular minima.
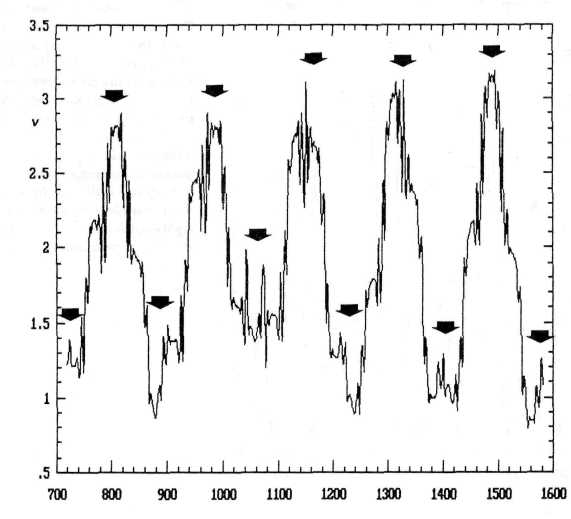
FIG. 1. Correlaion between the 36-yearrunning variance in the sun's orbital angular momentum (v) and the 80-year sunspot cycle, for the period 700-1600. Extrema in the variance v coincide with minima in the secular cycle of sunspot activity, the epochs of which are indicated by arrows.
As yet, the 20th century has continued to follow the regular cyclic pattern. Period 1 reached its peak in the second half of the 1950s, when the sunspot activity was extremely high. After an intermittent decrease around 1970, there was a steep ascent again. Period 2, the index of the current hand, peaked at the end of the 1980s. This marks the epoch of a further secular maximum, which is in accord with unexpectedly high sunspot activity observed in 11-year sunspot cycles 21 and 22.
It should not be forgotten, however, that period 2 is subject to instability as it coincides with retrograde solar motion and negative angular momentum. Considering that change in the sun's orbital angular momentum is fundamental to the concept in question, it seems consistent to assume that a switch in sign will have an effect. As a phase switch like that around 1811 did not occur, the anomaly will perhaps affect the dimension of the secular minimum related to period 3. A comparable situation occurred around 1670 when period 3, following retrograde solar motion in 1632, concurred with the Maunder minimum. The coming period 3 will peak around 2026. Period 4, the next pointer to a secular maximum, will reach its peak at the end of the 2050s.
Lake Saki Varve Thickness and Impulses of the Torque
A complete five-fingered hand covers a period of 178.8 years, the fundamental cycle in the sun's motion discovered by Jose (1965) and studied by Fairbridge, Sanders, and Shirley (Fairbridge and Sanders 1987; Fair-bridge and Shirley 1987). Dansgaard (Dansgaard et al. 1969) has derived a cycle of just 180 years in climate from the Camp Century ice core drilled from the Greenland Ice Sheet. This correspondence begs for investigation of a possible relationship of climate features with the complex pattern of the five-fingered hand, which reflects both variations in impulses of the torque in the sun's motion and secular sunspot activity.
The mean interval between fingers of the hand is 35.76 years, and the average distance from the peaks of fingers —major maxima in the running variance of IOT (KMAX)-to the deepest points between two neighboring fingers —major minima in the run ning variance of IOT (KMIN) — cover; 17.88 years.
In a thorough analysis of Lake Saki varves, Dewey (1964) found cycles with a corresponding length between 17 and 18 years. Hence, thickness changes in the varve deposits from Lake Saki, Crimea, were examined with regard to connections with the variance in IOT. Shostakovich, who published the varve data, which covers a period of 4189 years (2295 B.C. to A.D. 1894) (Shostakovich 1934), also presented evidence that related varve thickness to local precipitation: The thickest varves were linked to very wet years, and the thinnest varves to very dry years (Shostakovich 1936).
In his analysis, Dewey focused attention on a cycle of 17.3 years because he had found a cycle of nearly the same length in the flood stages of the River Nile. He noted, however, that a concurrent 17.75-year cycle was also present in the data. As a result of his analysis, Dewey assessed the dates of the ideal crests in the cycle he had found in the Lake Saki data. Dewey's crest dates do not perfectly fit the actual crests in the varve thickness in all single waves of the cycle. But when he fitted a sinusoid to each of the waves, measured the extent to which the actual crests concentrated around the time of the ideal crest, and calculated average values for groups of 48 waves each, all crests fell within 0.47 year of ideal timing. When the averaging was based on groups of 12 waves, the median irregularity did not go beyond 0.84 year.
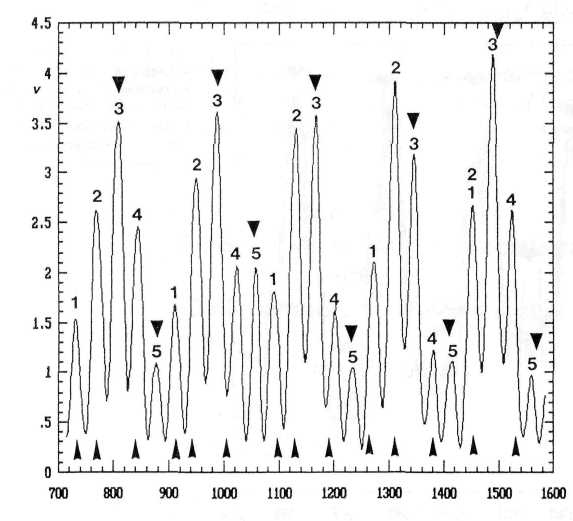
FIG. 2. Smoothed 9-year running variance in the angular momentum of the sun's motion about the center of mass of the solar system (v), for the period 700-1600. The cyclic pattern, formed by the curve, conveys the impression of five-fingered (pentadactyl) hands. Fingers 3 and 5 point to minima in the 80-year sunspot cycle, the epochs of which are marked by triangles. Fingers 1, 2, and 4 indicate secular maxima; respective epochs of intense solar activity are indicated by arrows. Perturbation of the penta-rhythm seems to induce stability. Tlie rightmost hand, lacking a finger, coincides with the Sporer minimum.
The Lake Saki varve data are noisy and show a serrated shape. The timing of major crests in a new investigation could be exposed to arguments. Therefore, independently assessed ideal epochs in Dewey's table were compared with the epochs of extrema Fmax and FMIN in the 9-year running variance of IOT.
In a first test, 33 FMAX epochs, emerging in the period 700-1894 at intervals of about 36 years, were related to every second ideal crest date from Dewey's list. The ideal crest date next to the first Fmax epoch determined the beginning of the continuous sequence formed by every second ideal crest. This sequence was disturbed only at the start of the Medieval maximum, also a climate optimum,
and at the beginning of the Maunder minimum. A phase change by n radians reflected synchronous signals in the variance of IOT. Half of the respective interval between consecutive Fmax was defined as a range into which associated ideal crest epochs can fall. Relative to FMAX at the center, this range covers ± 18 years.
Techniques based on impulses of the torque in the sun's motion could presumably help to forecast the sun's secular behavior and the earth's climatic response.
The evaluation of the deviation of ideal crest dates from Fmax data becomes easier when absolute values are considered. In a random distribution, the mean of the deviations of respective ideal crest dates from FMAX epochs in years would then be xi = 9. A Monte Carlo model based on 10,000 iterations yields the standard deviation (7i = 5.15. The parameters of the observed distribution are quite different: x2 = 4.97 andcr2 = 2.81. Student's t-test (Fisher-Behrens formula) yields t = 8.19 for 33 degrees of freedom. The rules valid for single-sided distributions apply: P < 6x 10 "7. The null hypothesis of no significant difference between the means involved can be rejected at a high level of significance.
This result is corroborated when FMIN epochs in their relation to the rest of the ideal crest dates are subjected to the same process, so that the ideal crests that were skipped now are continuously related to FMIN epochs. This procedure yields x3 = 4.5 and o-i = 2.34. The parameters of the control group, xi andcri are the same as before. Student's test results in t = 10.96 for 33 degrees of freedom; P < 6 X 10 "8. The null hypothesis of no correlation with the epochs of FMIN is rejected at a high level of significance. A X2-test and a nonparametric Mann-Whitney-test yield the same results.
The combined tests of Fmax and FMIN point to a real difference between the random group and the observed group; they substantiate the working hypothesis of a relationship between extrema in the variance of IOT, connected with solar activity, and Lake Saki varve thickness, related to local rainfall. Further computa tions, which cover all data back to 2295 B.C., currently are underway. The results will be published soon, as well as the yield of another approach that evaluates actual maxima in smoothed varve thickness in relation to Kmax and Kmin.
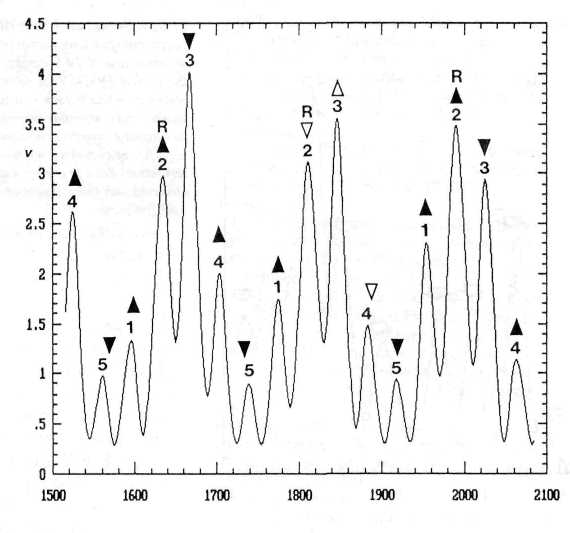
FIG. 3. Pentadactyl pattern, as presented in Figure 2, for the period 1500-2100. Triangles pointing upwards and downwards mark epochs of maxima and minima in the 80-year sunspot cycle. Perturbing phases of retrograde solar motion, designated by R, seem to be linked to instability. After 1811, the extrema in the correlated secular sunspot cycle switched phase. Open triangles focus attention on this anomaly, the only event in 1300 years of data examined. Retrograde motion in 1632 and 1990 did not perturb the regular rhythm. Period 3 after 1632, however, concurred with the Maunder minimum. Period 3 after 1990, peaking in 2026, could have similar implications.
Shostakovich's varve data show a mean thickness t = 1.2 mm. Thickness t > 80 mm can be considered extreme. Only nine such events were observed in 4189 years. In conformance with the proposed working hypothesis, all of these outstanding events occurred close to Fmax and Vmin in IOT. When waves running from Kmax to FMIN are normalized to 100, all events t > 80 mm fall within 10/100 of a wavelength around Fmin, and within 5/100 to 15/100 of a wavelength around Kmax. AX2-test yields the value 13.5 for 1 degree of freedom: P < 0.0003.
Connection of Rainfall and Temperature With Impulses of the Torque "...
Lake Saki varves offered the opportunity to look into a special relationship confined to local climate but covering many centuries. The following connection of IOT with climate covers merely 13 decades, but comprises different areas of the Northern Hemisphere. The IOT features presented so far constitute the most prominent phenomena related to major maxima and minima.
The variance shown in Figures 2 and 3 was subjected to a Gaussian low-pass filter to eliminate all patterns that emerged in a range shorter than 30 years. The unsmoothed data reveal intermittent maxima and minima in the 9-year running variance v of IOT. Major as well as intermittent minima in v occur when Jupiter, which contributes most to the sun's motion about CM, the center of mass itself, and the sun's center (CS) are in line (JU-CM-CS events). Maxima in v, including intermittent maxima, develop near the middle between two consecutive JU-CM-CS events. Henceforth, all minima in the 9-year running variance in IOT are termed vMin, and all corresponding maxima vMax.
Rainfall
These extrema seem to be connected to rainfall over Central Europe. Figure 4 shows the smoothed 2-year running variance v, of yearly rainfall totals derived from observations of 14 German stations by Baur (1975). This homogeneous time series, supplemented by data from "Berliner Wetterkarte," published by the Me-
teorological Institute of the Free University of Berlin, covers the period 1851-1983. The distribution is Gaussian and free from Marko-type persistence. Daily or monthly data show some persistence patterns, but these were eliminated by the formation of yearly means.
The 2-year running variance, smoothed by a Gaussian low-pass filter, focuses attention on the change in variance from year to year. Peaks in the plot point to strong contrast in the rainfall of consecutive years — very wet years follow very dry years, or very dry years follow very wet years —whereas minima indicate little contrast in this respect. Arrows in Figure 4 mark epochs of vMin, and open circles designate dates of vMax. The plot conveys the impression of a strong correlation of vMin with peaks in vr, and of vMax with troughs in vr. Only at the secular sunspot minimum around 1900, the vMax connection is weak or even disappears. Possibly this is due to the lack of releasable magnetic energy stored in large sunspots.
The first impression of a good correlation is confirmed by a series of statistical tests. The probabilities resulting from different approaches in f-tests range from P < 0.0002 to P < 0.00003. The null hypothesis of no connection with IOT may be considered disproved. A replication was made by means of yearly rainfall averages in England and Wales for the years 1850-1976 (Lamb 1977, p. 621-625). The probability of false rejection of the null hypothesis of no correlation is low again: P < 0.004. Another replication makes use of the yearly total rainfall (mm) in the eastern United States, reduced to Philadelphia equivalent values, for the period 1850-1967 (Lamb 1977, p. 625-628). The outcome is P < 0.009.
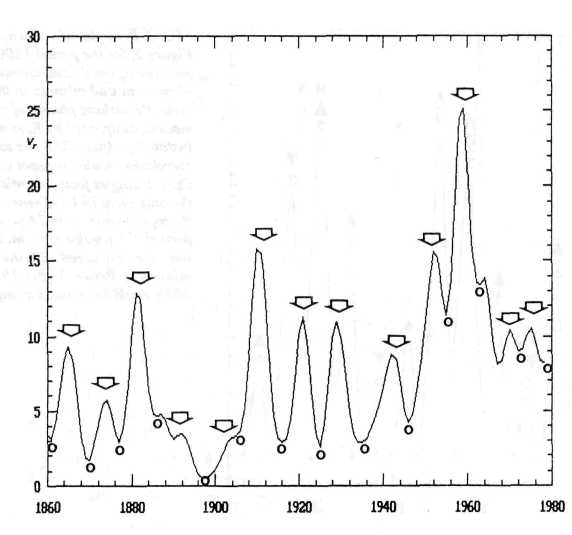
FIG. 4. Smoothed 2-year running variance v, of yearly rainfall totals (mm) derived from observations of 14 German stations by Baur, for the period 1851-1983. Arrows mark epochs of minima in the 9-year running variance v of the sun's orbital angular momentum. Open circles designate respective maxima in v. The significant correlation between these solar and terrestrial data is corroborated by rainfall observations from England, Wales, eastern U.S., and India.
Data from the equatorial region, too, were examined. Yearly monsoon season (June-September) rainfall (mm) at Bombay from 1850 to 1960 (Lamb 1977. p. 631) showed a significant correlation (P = 0.014) when a phase shift by ji/2 radians was allowed for. This phase shift, emerging in low latitudes, is no ephemeral feature. It was confirmed by the analysis of All-India summer monsoon rainfall (mm) from 1871 to 1978 (Mooley and Par-thasarathy 1984): P = 0.005. Therefore, a two-phase system with relation to the geographical latitude seems to be a promising approach.
Temperature
Temperature opens up a further field for replication. Baur (1975) established a time series of yearly temperature averages based on the respective means of the stations Utrecht-de Bilt, Potsdam, Basle, and Vienna. With extensions taken from the "Berliner Wetterkarte," the series covers the period 1851-1983. The highly significant result of a f-test yields P < 0.002. Yearly mean temperatures in central England from 1851 to 1976 (Manley 1974; Lamb 1977, p. 574-576) confirm this result, though on a lower level of significance: P < 0.05. As was to be expected at this latitude, there are no indications of a phase shift.
With regard to temperature, peaks in the 2-year running variance connected with vMin are characterized by alternately hot and cold years, whereas troughs, correlated to vMax, point to consecutive years with little contrast in temperature. For details of the statistical tests reported in this section, refer to the comprehensive paper, "Solar Rotation, Impulses of the Torque in the Sun's Motion, and Climatic Variation" (Landscheidt 1988).
The first results of this interdisciplinary approach certainly are in need of further corroboration by replications based on new data that cover long time series and various geographical regions. With regard to possible phase shifts, it seems not advisable to investigate global data. An analysis of annual average temperatures of the Northern Hemisphere yielded no significant results. This may be due to phase differences in different geographical latitudes that cancel out.
If appropriate replications confirmed the studied connection, this could be of practical importance — as, for example, the probability of a wet year following another wet year, or of a drought year following another drought year, would then be much higher at vMax epochs than near vMin. These prospects should be intriguing enough to induce climatologists and meteorologists to engage in further investigations. Hopefully, this could lead to progress in forecasting climatic variability, in addition to the long-range predictions of energetic X-ray flares and outstanding geomagnetic activity being practiced already.
References
Baur, F. 1975. Abweichungen der Monatsmittel der Temperatur Mitteleuropas und des Niederschlags in Deutschland, Beilage zur Wetterkarte des Institus fur Meteorologie der Freien Universitat Berlin vom 24. 6.1975.
Dansgaard, W.; Johnsen, S.J.; Moller, J.; Langway, C.C.
1969. One Thousand Centuries of Climate Record from Camp Century on the Greenland Ice Sheet. Science 166:377-381.
Dewey, E.R. 1964. The 171/3-year Cycle in Lake Saki Var-ves. Research Bulletin 1964-1. Foundation for the Study of Cycles, Pittsburgh, p. 1-66.
Fairbridge, R.W.; Sanders, J.E. 1987. The Sun's Orbit, A.D. 750-2050: Basis for New Perspectives on Planetary Dynamics and Earth-Moon Linkage. In Rampino, Sanders, Newman, and Konigsson, eds., Climate: History, Periodicity, and Predictability. Van Nostrand Reinhold, New York, p. 446471.
Fairbridge, R.W.; Shirley, J.H. 1987. Prolonged Minima and the 179-year Cycle of the Solar Inertial Motion. Solar Physics 110:191-220.
Faure, H.; Gac, J.Y. 1981. Will the Sahelian Drought End in 1985? Nature 268:475-478.
Foukal, P.V., 1990. The Variable Sun. Scientific American
262:34-41. Foukal, P.V.; Lean, J. 1988. Magnetic Modulation of Solar Luminosity by Photospheric Activity. Ap. J. 328:347-357.
Geller, M.A. 1989. Variations Without Forcing. Nature 342:15-16.
Gleissberg, W.J. 1958. The 80-year Sunspot Cycle. / Brit Astron. Ass. 68:150.
Jose, P.D. 1965. Sun's Motion and Sunspots. Astron. J. 70:193-200.
Kuhn, J.R; Libbrecht, K.G.; Dicke, R.H. 1988. The Surface Temperature of the Sun and Changes in the Solar Constant. Science 242:908-911.
Labitzke, K. 1987. Sunspots, the QBO, and the Stratospheric Temperature in the North Polar Region. Geophys. Res. Letters 14:535-537.
Lamb, H.H. 1977. Climatic History and the Future. Climate Present, Past, and Future, vol. 2. Methuen, London.
Landscheidt, T.
1976. Beziehungen zwischen der Sonnen-aktivitat und dem Massenzentrum des Son-nensystems. Nachr. Olbers-Gesellschaft No. 100, 3-19.
1981. Swinging Sun, 79-Year Cycle, and Climatic Change. /. Interdisc. Cycle Res. 12:3-19.
Link, F. 1978. Solar Cycles Between 1540 and 1700. Solar Physics 59:175-178.
Manley, G. 1974. Central England Temperatures: Monthly Means, 1659 to 1973. Quart. J. Roy. Met. Soc. 100:389-405.
Mooley, D.A.; Parthasarathy, B 1984. Fluctuations in All-India Summer Monsoon Rainfall, 1871 -1978. Climatic Change 6:287-301.
Shostakovich, W.B. 1934. Bodenablagerungen der Seen und periodische Schwankungen der Naturerscheinungen. Memoires de I'Institut Hydrologique 13:95-140, Leningrad. 1936. Geschichtete Bodenablagerungen der Seen als Klima. Ann. Met. Z. 53:176-182.
Published on
http://bourabai.narod.ru/ according permission of Frau Christiane Landscheidt