1992 Cycles Prize Winner
On April 25, Theodor Landscheidt was awarded the 1992 Cycles Prize in honor of his outstanding contributions to the world of cycle research. He presented the following paper at the Foundation's annual conference.
Born in Bremen, Landscheidt studied philosophy, law, and natural sciences at the University of Goettingen, where he earned his doctorate. He was a West German High Court judge until his retirement, when he became Director of the Schroeter Institute for Research in Cycles of Solar Activity in Nova Scotia. He has been elected a member of various academies and of the American Geophysical Union.
Since 1974, Landscheidt has made long-range forecasts of energetic solar eruptions and geomagnetic storms, with a success rate of better than 90%. He successfully forecast the end of the Sahelian drought and has correctly identified the turning points in various economic cycles. Landscheidt has published widely in both German and English on solar-terrestrial cycles. His latest book, SUN-EARTH-MAN: A MESH OF COSMIC OSCILLATIONS, explains how planets regulate solar eruptions, geomagnetic storms, conditions of life, and economic cycles.
Hidden Cycles in Nature, Man, and the Economy
The Golden Section: A Building Block of Cyclic Structure
by Theodor Landscheidt
E
dward R. Dewey (1970) knew he was engaged in an intricate and disconcerting endeavor: "The study of cycles reveals to us our ignorance, and is therefore very disturbing to people whose ideas are crystallized."At times, all of us are subject to such experience. In the technical analysis of data, we always look for peaks and troughs. When a sequence of maxima emerges at reasonably regular intervals, we automatically assume they are crest phases of a cycle, the ascending nodes of which precede the crests by 90°. This inference, however, may be misleading. Cycles often possess inner structure that conspicuously deviates from the standard pattern of a sinusoidal wave.
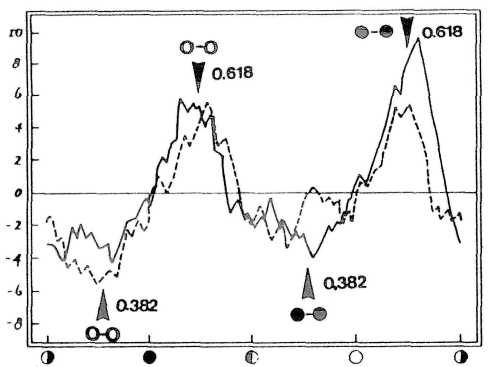
Figure 1 shows the result of a study by Bradley, Woodbury, and Brier (1962). They looked for correlation between the moon's phases and 16,056 heavy rainfalls at 1544 U.S. weather stations, 1900 to 1949. The horizontal axis represents a complete series of lunar phases from last quarter to last quarter; the filled circle is the new moon and the open circle the full moon. As a statistical precaution, the data set was divided in half. The data from 1900 to 1924 (solid line) correlates well with the data from 1925 to 1949 (dashed line).
The cyclic peaks are significant yet show no direct connection with any lunar phase. Thus, most scientists dismissed any correlation between the lunar cycle and rainfall. Grudgingly, I assumed the same attitude, based on the concept that cycles should behave like sinusoidal waves.
The eye-opener for me came when I examined the distribution of energetic solar eruptions within a cycle of tidal forces generated by Venus, Earth, and Jupiter. The highly significant peaks in this distribution shunned the cardinal phases of a sinusoidal wave and followed a distinct golden-section pattern within the tidal cycle (Landscheidt 1990a). Henceforth, I was sensitive to manifestations of the golden-section proportion within cycles of all kinds.
Consequently, I was able to see that the peaks in FIGURE 1 fall just at the golden section of lunar cycles: the lower peak (left) within the cycle from full moon to full moon, and the higher peak (right) within the cycle from new moon to new moon. The respective golden sections are marked by arrowheads.
The Golden Section
The golden section divides a line so that the ratio of the whole line to the larger interval equals the ratio of the larger interval to the smaller one. The proportions of a Greek temple (see FIGURE 2) reflect the pleasing aesthetic ratio of the golden section.
FIGURE 1. Correlation between the moon's phases and U.S. rainfall maxima, 1900 to 1924 (solid line) and 1925 to 1949 (dashed line). Within cycles from full moon to full moon (open circles) and from new moon to new moon (filled circles), rainfall maxima coincide with the major (0.618) of the golden section, whereas rainfall minima coincide with the minor (0.382). After Eyscnck and Nias (1982).
The height of the temple from base to top (height) is divided at point G into a larger interval ("major") and a smaller interval ("minor") according to the following ratio:
HEIGHT / MAJOR = MAJOR / MINOR
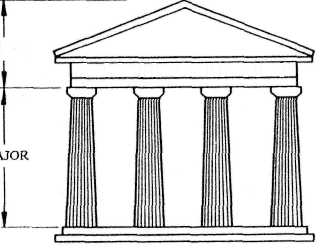
FIGURE 2. Proportions of a Greek temple that illustrate the golden section. Point G represents the golden number 0.618. This point divides the height of the temple into major (0.618) and minor (0.3819) intervals.
Figur 3 corroborates the message of figure 1, though in a quite different realm and in a more complex way. The wave pattern is dominated by two cycles derived from solar system dynamics. The solid line plots the rate of change of the U.S. gross national product from 1974 to 1990. The outstanding peak in the early 1940s is a war distortion. Of the cycles present, longer cycles are related to "big fingers" and shorter cycles are connected with "small fingers." (Fingers will be discussed below.)
Initial phases of big-finger cycles are marked by rectangles, those of small-finger cycles by arrowheads. Filled circles designate the golden-section major within small-finger cycles, measured from the initial phase of the respective cycle. The wave pattern points to a bistable oscillator.
In the first section of the plot up to the first rectangle at 1901, starting phases of the small fingers (arrowheads) align with peaks in the gross national product; the golden sections in between (filled circles) are related to bottoms. At the starting phase of the big finger in 1901, the mode switches. The arrowheads now point to bottoms and filled circles designate peaks.
Additional phase reversals occur at the starting phases of big fingers in 1933 and 1968. The next switch will come in 2007. Hence, the next peak in the rate of change of the U.S. gross national product, indicated by a golden section phase, should materialize in 1995. The next trough, linked to the starting phase of a small finger, is expected in 1998.
The Solar Influence
Those fingers involved in such diverse fields as meteorology and economy are related to solar system dynamics. They emerge when we delve into the sun's activity. Sunspot cycles are a challenge to cycle research. E.R. Dewey dedicated much of his lifetime to the investigation of these mysterious rhythms. He was rightly convinced they are a kind of Rosetta stone for deciphering the hidden texture of terrestrial cycles.
The well known 11-year sunspot cycle is very irregular. Cycle duration varies between 7 and 17 years, and the peaks differ dramatically in height. In FIGURE 4, the jagged dashed line outlines the 11-year sunspot cycle. When the data are smoothed, a long cycle of about 90 years emerges (solid line). This Gleissberg cycle shows distinct minima and maxima that relate to long-term climatic change.
If the total height is assigned the unit value of 1.0, major = 0.618... and minor = 0.3819.... The "golden number" G has the value 0.618.... To find the major of a line of any length, multiply it by G. Multiplication by 0.3819... yields the corresponding minor.
The length of a cycle can be sub-J§§t§d t© thg same proceis, When the f olden section is applied to the data in MeURi i, if ii apparent that troughs ia rainfall coincide with the minor in the cycles from full moon to Ml moon and from new moon to new moon, Altogether, this is a rather exact relation to cardinal lunar phases. However, if the lunar cycle were not so well known and easily visible in the skies, the cyclic connection could be very difficult to recognize.
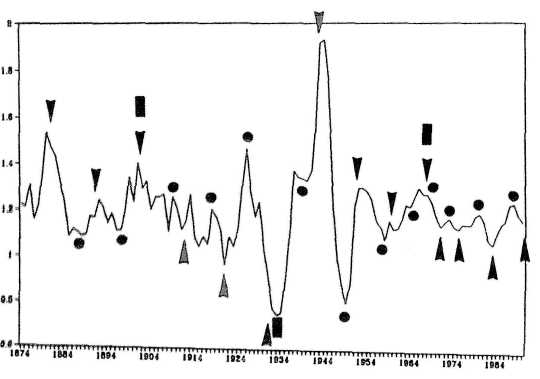
FIGURE 3. Rate of change of the U.S. Gross National Product (GNP), 1874-1990. Starting phases of "big finger" and "small finger" cycles are marked by rectangles and arrowheads, and golden-section majors within small-finger cycles by circles. After Mogey (1991).
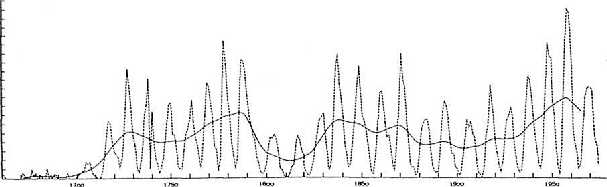
FIGURE 4. The 11-year sunspot cycle (broken line) and the Gleissberg cycle (solid line) of about 90 years. Gleissberg minima in sunspot activity occurred about 1670,1740, 1810, and 1900. After Schonwiese (1979).
The deep Maunder minimum about 1670 coincided with the Little Ice Age. The more shallow minima around 1740, 1810, and 1900 also marked times of colder climate. Even between 1960 and 1975, when sunspot activity became only a bit weaker, global temperatures fell despite increasing industrialization and the greenhouse effect. Consequently, he who can predict the next Gleissberg minimum can also predict the next spell of colder climate.
The solution of this problem is linked to the solar system as a whole. FIGURE 5 shows a strange cycle formed by the sun's oscillations about the solar system's center of mass. This oscillatory motion is regulated by constellations of the giant planets Jupiter, Saturn, Uranus, and Neptune. Open circles mark the celestial positions of this center relative to the sun's center (cross) for the years 1945 to 1995. Most of the time, the center of mass is located outside the sun's body.
The sun's center can reach a distance of more than two solar radii from the center of mass, or it can make a very close approach to it, as in 1951 and 1990 (Jose 1965). In the sun's irregular cyclic motion between these two extremes, its orbital angular momentum can increase or decrease forty-fold. The transfer of orbital angular momentum to the sun's spin momentum—and there is evidence of iiTmn affeet solar mtwiiy (Land-
The dwaiBiei in the sun's motion about the eenter of mass can be defined quantitatively by the change in its angular momentum. The rate of tives. In some respects, the running variance yields more informative results. The smoothing technique of running means over two, three, or more consecutive readings with equal or different weights is applied to variance, the square of the standard deviation.
Figure 6 presents the 36-year running variance v of the sun's orbital angular momentum for the years 700 to 1600. It solves the problem of how to forecast periods of weak solar activity and colder climate. Arrows mark the observed epochs of Gleissberg minima assessed by Gleissberg (1958) and Link (1978). All these minima coincide with distinct extrema in the 36-year running variance of the sun's angular momentum. This is also true for the following centuries.
According to my calculations, the next minimum in the 90-year sunspot cycle —half of a "big hand" cycle of 180 years—is expected about the year 2026. Indications are that a grand minimum of the Maunder Minimum type and a new Little Ice Age comparable to that of the seventeenth century may occur then (Landscheidt 1990b). Recent results of climatologists show that the greenhouse effect cannot eliminate this development (Ramanathan et al. 1989; Beardsley 1989; Meier 1990; Kiehl 1991).
Certain quantum field theories have demonstrated that renormaliza-tion transformations involving a change of scale can be a useful research tool. Nobel Prize recipient K.G. Wilson displayed that this principle can be applied universally. If you are stalled in your research, choose a coarser or finer scale.
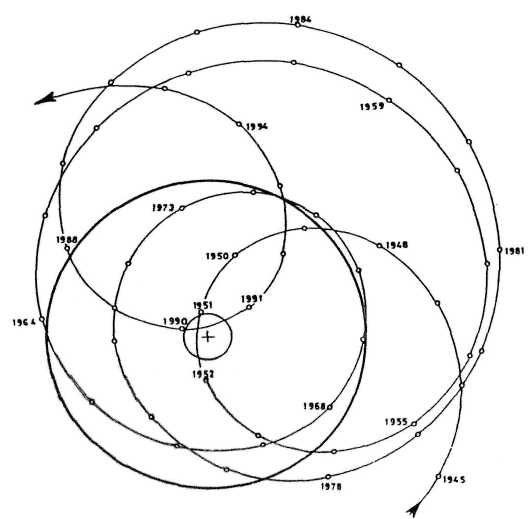
FIGURE 5. The sun's oscillations about the solar system's center of mass, 1945-1995. Shown are celestial positions of the solar system's center of mass (small circles) relative to the sun's center (cross). The large heavy circle describes the sun's surface. The center of mass and the sun's center can come close together, as in 1951 and 1990, or reach a distance of more than two solar radii. Between these two extremes, the sun's orbital angular momentum can increase or decrease forty-fold.
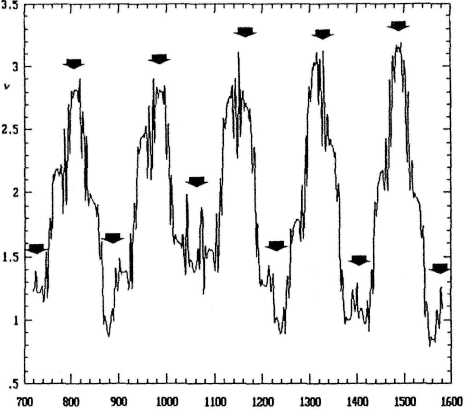
FIGURE 6. 36-year running variance in the sun's orbital angular momentum, 700 to1600. All extrema coincide with observed Gleissberg minima (arrows). This is also true for later centuries. The next Gleissberg minimum, expected around 2026, will be a deep minimum of the Maunder minimum type.
"Fingers" and "Hands"
FIGURE 7 shows the 9-year running variance of the sun's orbital angular momentum for the years 720 to 1070. Based on a finer scale that amplifies the results shown in FIGURE 6, it reveals big "hands" with big "fingers." These five-fingered hands are an utter surprise. Scientists conceive that the sun is a body composed of dead matter. As such, the sun should not display five-fold symmetry—two-fold, threefold, four-fold, or six-fold symmetry like crystals, but not five-fold symmetry reserved for the realm of biology.
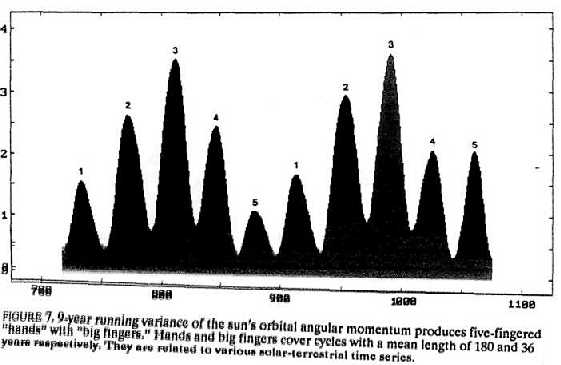
As we shall see later, the emergence of the number five in the dynamical pattern of the sun's motion about the center of mass connects it with the golden section. Since the big outer planets regulate the sun's motion, the whole solar system seems to be tuned into this golden proportion.
Another ubiquitous notion in present-day science is the term "fractal" coined by Mandelbrot (1983). He stressed that clouds are not spheres, mountains are not cones, and lightning does not travel in a straight line. A fractal is a geometrical shape that, when magnified or reduced by a given factor, reproduces the original object. Self-similarity on different scales is a preeminent feature of fractals. A good paradigm is the unending sequence of Russian babushka dolls, one nestled inside the other.
I was astounded to see fractals in the sun's motion. The big fingers in big hands contain small hands with small fingers. This becomes apparent by further amplification.
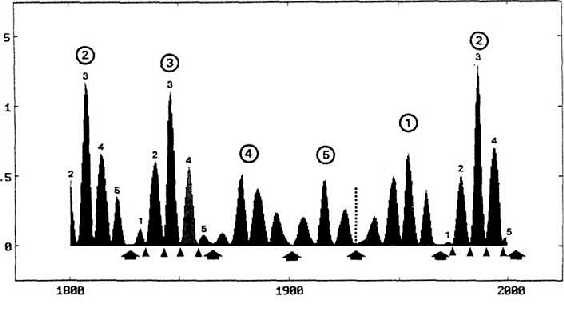
FIGURE 8 shows the 3-year running variance of the sun's orbital angular momentum. The circled numbers at top mark the big fingertips. The small fingers are marked with small numbers; arrows and triangles designate the starting phases of big and small fingers, respectively.
The vertical dotted line marks the starting phase (1933) of a big hand. This dynamically fundamental period coincided with establishment of Stalin's and Hitler's dictatorship and the Great Depression. Thus, Mogey (1991) rightly conceived that the Great Depression was an anomaly in nearly any time series the Foundation evaluated —an extreme example, not the rule, so it cannot be related to the Kondratieff cycle of about 54 years.
The start of a big hand in 1756 was another crucial period. The Seven Years' War in Europe gave Great Britain, as an ally of Prussia, the opportunity to establish its Empire by the conquest of India and Canada.
The mean durations of the solar finger cycles are as follows:
big hand 180 years
half big hand 90 years
big finger 36 years
half big finger 18 years
small finger 7-8 years
half small finger 3.5 years (42 months)
These periods are rounded mean lengths; the real fingers differ in width. Yet all these variations can be computed and predicted.
A set of corresponding terrestrial cycles also form a fractal structure. Many of the long cycles established by the Foundation can be construed as multiples of big finger or half big finger cycles. Thus, the length of the Kondratieff Wave is equal to three half big fingers; three big fingers cover the 107-year cycle of crises and panics; and four big fingers constitute the 143-year cycle of international battles.
The analysis of varves, the annual deposition of graded layers in glacial lakes, provides data on past climates. Thin varves usually indicate cold years and thick varves warm years. Dewey (1964) made a thorough analysis of varves taken from Lake Saki in Russia and found a cycle of 17-18 years. His crest data conform with consecutive cycles formed by half big fingers (Landscheidt 1990b). Statistically, the results, which cover 12 centuries, are highly significant (P = 10" ).
Interestingly, the epochs of big fingertips and of national uprisings and revolutions follow the same rhythm: c. 1815 uprising against Napoleon 1848 democratic movements and revolts in France, Italy, and central Europe c. 1878 successful insurrection of Balkan countries against Turkish domination 1917-1918 revolutions in Russia and Germany 1956 Hungarian revolt against Soviet occupation
1987-1989 liberation of peoples in central and eastern Europe from communism. The next period of this kind is expected about the year 2026.
A host of solar and terrestrial cycles are connected with small fingers. For example, FIGURE 9 is a plot of the number of south polar faculae on the sun, 1906 to 1975 (solid line). There is no coincident movement with the magnetic 22-year sunspot cycle (dashed line), but a neat synchronism with starting phases of small fingers (arrowheads) that coincide with ex-trema in the data of faculae, with one exception.
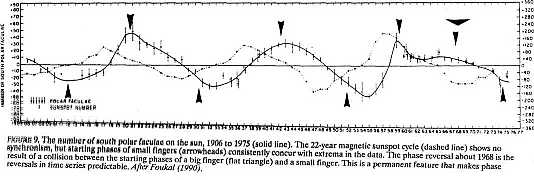
A phase reversal—an irregular maximum instead of the regular minimum — occurs when the starting phase of a big finger in 1968 (flat triangle) collides with the initial phase of a small finger. The new rhythm continues until the next starting phase of a big finger intervenes. This general feature suggests the possibility to predict those phase jumps in time series that we often observe. This feature is found in terrestrial cycles, also.
Figure 10 presents the U.S. building cycle, 1952 to 1987, as a plot of 9-year smoothed growth rates. Starting phases of small fingers (short arrows) and tips of small fingers (triangles) ran parallel with maxima in building activity until 1968, the initial phase of a big finger (long arrow).
After the disturbance by the big finger, the pattern changed completely: the starting phases indicated minima and the fingertips maxima. As expected, the next minimum phase began in 1990. The coming maximum phase should materialize in 1994. Different time series show different individual traits, but the fundamental pattern is always the same.
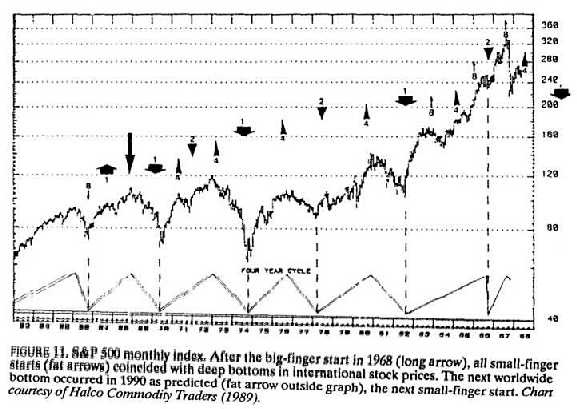
FIGURE 11 is a plot of Standard & Poor's 500 index, 1963 to 1988, to which I added some markers (Landscheidt 1989b). After the starting phase of a big finger (long arrow) in 1968, all deep bottoms in stock prices-1970, 1974, and 1982-coincided with starting phases of small fingers (fat arrows).
This is why I had predicted for years that the next worldwide deep bottom in stock prices would occur in 1990. The fat arrow outside the graph on the far right points to the pending event. In 19891 wrote: "Because of the imminent... event, the epoch of which is 1990.3, a bottom may be expected such as occurred in 1970, 1974, and 1982. But this will also be the start of a new rally" (Landscheidt 1989b). Both of these came about —the international bottom in stock prices and the ensuing rally with new record highs.
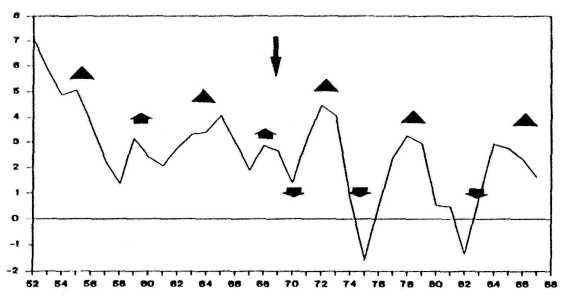
FIGURE 10. U.S. building cycle, 1952-1987, as a plot of 9-year smoothed growth rates. The starting phase of a big finger in 1968 (long arrow) brought about a reversal. Initial phases (arrows) and tips (triangles) of small fingers are shown. After Niemira (1988).
The big triangle outside the graph at the top right designates the tip of a big finger in 1987, which concurred on a larger scale with the reverse situation: the highest peak of the steep rally that began in 1982 and the ensuing crash in October 1987. In a January 1986 forecast, I predicted this international turning point in the boom (Landscheidt 1989a).
Many more examples of the effectiveness of small finger cycles are given by Landscheidt (1989a), but even that collection is not complete. Epperson (1989) assessed the timing of the current idealized crests of 16 different 4-year cycles. The average turning times fell at 1982.5,1986.5, and 1990.5. The respective starting phases and tip phases of small fingers are 1982.8, 1986.6, and 1990.3. Landscheidt (1989a) lists such epochs of small finger phases for the period 1800 to 2000.
The Number Five, the Logarithmic Spiral, and Fractals
Figure 12 presents another example of the golden section's ubiquity: Wheeler's index of international battles. The data are structured by big finger cycles with initial phases of 1867, 1901,1933, 1968, and 2007 (triangles). Alternately, they are related to minima and maxima in the number of battles. The next minimum of this kind should develop about 2007.
Now apply the golden section to the lengths of each big-finger cycle to find two inner points: the distance of the minor from the big finger's starting-phase and the distance of the major from this start. A consistent alternating pattern can be seen, as with the initial phases of the big fingers.
In the first complete big-finger cycle from the left, the minor (circle) coincides with a peak in battles and the major (star) with a trough. In the next cycle, the relationship is reversed. Now the minor points to a trough and the major to a large peak. The next cycle shows another reversion. The minor coincides with the battles of the second world war and the major with a trough in the index. The Gulf war fell into the range of effect of the major in 1992 (star, far right). We still live in this active phase.
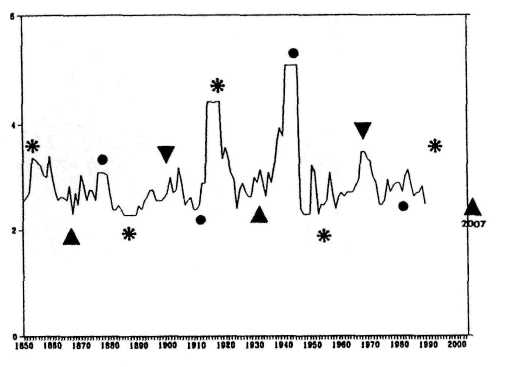
FIGURE 12. Wheeler's index of international battles. Big finger starts (triangles) alternately point to minima and maxima in the data. The minor (circles) and major (stars) golden-section points within the big fingers also alternate. The next maximum should develop around the minor in 2021, with a lull about 2007. After Mogey (1991).
Forecasting is easy. The next minimum is expected about 2007, and the next peak about 2021. Consequently, the observation of golden-section points within cycles seems to be essential. The sun itself reveals which structural elements are important. The sun's dynamical fingers point to the number five, a close relative of the golden section.
The number five, represented by a pentagon, is closely connected with the golden section. When all corners of the pentagon are connected by diagonals (FIGURE 13), a five-pointed star emerges. The intersecting lines of this pentagram form a web of golden sections. Within this star emerges a smaller pentagon that contains a smaller star with golden section divisions, and so on, in an infinite fractal sequence. Literature that delves into this connection is widespread (Kappraff 1991; Huntley 1970).
Another close relative of the number five is the logarithmic spiral. FlG-URE 14 shows a golden rectangle, ADCB, that can be constructed easily from the square AFEB. Its proportions follow the golden section. The construction of smaller and smaller golden rectangles within golden rectangles produces a whirling fractal that gives birth to a golden spiral. This logarithmic spiral is the prototype of self-similarity, a fundamental fractal that resembles itself on any scale.
Bernoulli, the Swiss mathematician who studied the spiral's properties, had it chiseled into his tombstone with the inscription, Eadem mutatus resurgo ("Transformed and yet the same, I shall rise from the dead"). This archetype is found in the spiral arms of huge galaxies and in the shapes of tiny creatures. A radiograph of the shell of the chambered Nautilus, a beautiful modern sea shell, shows this phenomenon (pictured on the magazine cover). The size of the chambers, in which the Nautilus pompilius lives, increases with growth, but their shapes, based on the logarithmic spiral, remain proportionately unaltered.
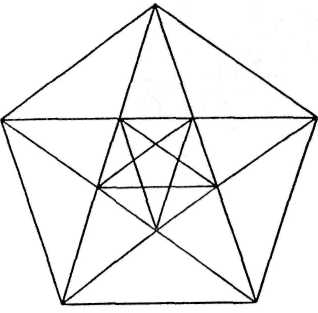
FIGURE 13. When all corners of a pentagon are connected by diagonals, a five-pointed star emerges. Its intersecting lines form a web of golden sections. Within this star is a smaller pentagon, containing a smaller star. Subdivision can be repeated to infinity.
The golden spiral is intimately connected with cycles. Simple cyclic mathematical operations involving feedback, now studied in the new science of chaos, give birth to a wealth of fractal forms never seen before. FIGURE 15 shows the famous Mandelbrot set (panel a), a one-page dictionary of an infinity of individual patterns, called Julia sets, that all look different. Some scientists relate the Mandelbrot set to the genetic code found in the nuclei of cells. Consecutive amplifica-Ilifl §f fteyfltefy isetlens fllscloie at-tfsetlve patterns of artistic complexity (pantli 6, e, and d), what do we find? Logarithmic spirals!
None of the professional "chaos" researchers seems to recognize that this finding suggests a close connection between cycles, the number five, the golden section, and the logarithmic spiral. To understand cycles in depth, these root elements and their connections must be considered. Why should we be astonished that the solar wind, created by the sun's activity, forms a logarithmic spiral while it spreads out in the solar system (Foukal 1990)?
Influence on Man's Behavior
In Sun-Earth-Man (Landscheidt 1989a), I provided evidence that man's activity and even creativity are linked to the sun's activity. Heliocentric constellations of planets are indirectly involved in this connection, as they regulate the sun's activity by means of its oscillations about the center of mass of the solar system.
If this knowledge about the fundamental importance of the golden section is applied without prejudice, special constellations of planets as seen from the earth can be shown to have some influence on man's behavior. The golden section seems to play an eminent part, not only in circadian rhythms but also in man's performance in profession.
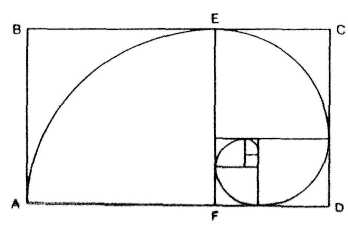
FIGURE 14. A whirling fractal of golden rectangles creates a logarithmic spiral, revealing a close relationship between the golden section and the golden spiral.
For man, the day on earth is one of the most important cycles. Winfree (1987) put it this way:
We live on a rotatingplanet. We grew up here. For three billion years, life here has grown and adapted, passing from cell to cell innumerable times in unbroken descent, generation after generation. All the while, we have felt the sky brighten and darken again and again while the planet relentlessly rotated: a trillion cycles of brightness and dark, never missing a beat, always felt deep in the chemical essence of what we are. We are well adapted to the pervasive rhythm of sunrise and sunset.
This also is true of the rising and setting of the moon and planets. Fig-URE16 shows a schematic representation of the diurnal circle. The sun, moon, and planets rise at R, reach upper culmination at UC, set at S, pass through the lower culmination at LC, and return to the rising point R. In reality, these are four cycles of different quality: from rising to the next rising, from upper culmination to upper culmination, from setting to setting, and from lower culmination to the next lower culmination.
As these are real cycles that could have an inner structure, the French psychologist Gauquelin from the University of Paris sought to find a link between individual birth times and the diurnal circle. He compared the birth times of thousands of eminent professionals from well-defined vocational groups with the corresponding distribution of sun, moon, and certain planets in the diurnal circle.
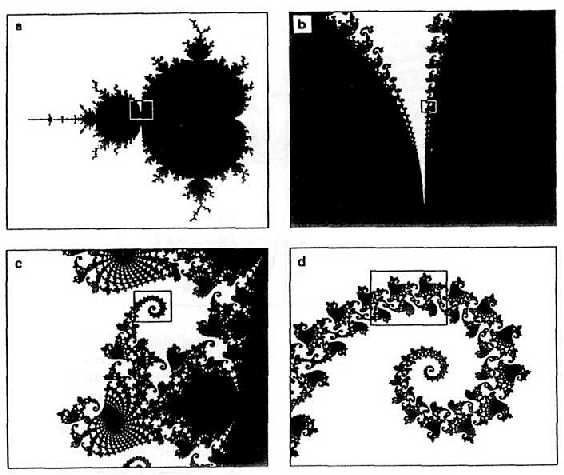
FIGURE 15. Mandelbrot set (panel a) and Julia sets (panels b, c, and d), disclosing a relationship between feedback cycles, the logarithmic spiral; the golden section, and five-fold symmetry found in the sun's dynamics. Rectangular frames locate the portion amplified in next panel. Elaborated by Peitgen (1988).
Gauquelin found highly significant deviation from the expected random distribution. The frequencies were considerably higher about 90 minutes after rising and upper culmination, and to a lesser degree at the opposite positions.
Though Gauquelin's statistical work was state of the art and could be reproduced with new data, there was much criticism. Accumulations in the diurnal circle did not fall directly at the cardinal points of rising, culmination, and setting; they built up in between, and not even symmetrically. However, when the golden section is taken into account, the accumulations are seen to be exactly related to the cardinal points in the diurnal circle (Landscheidt 1992).
The Golden Crosses
in Raima 16, the origin a! the diurnal eifgle, 08, m set at R, the rising paint, BtAft at origin 0" and move eeuntgfglockwise around the circle, following the earth's rotation. Multiply the length of the first cycle, R-R (MO*, the distance from 0s to 360"), by positions of 227.5°, 317.5°, and 47.5°. These four minor positions (filled circles) form a cross, Golden Cross 1 (GK1).
Nested within the large cycles are smaller cycles. The horizontal semicircles (rising to setting, setting to rising) have as different qualities as day and night. The vertical semicircles, with celestial bodies ascending and descending, also are qualitatively different. Now calculate the minor positions in each of the four 180° semicircles, starting with origin 0°. Multiply the length of the first cycle, R-S (180°, the distance between 0° to 180°), by the minor 0.382 to get 68.8°, the minor position for R-S.
Next plot the minor positions for the remaining three semicircles, starting from each successive cardinal point. These four minor positions (open circles) form Golden Cross 2 (GK2). I was rather surprised to find these golden crosses mark the same directions in the diurnal circle that Gauquelin had singled out.
Figure 17 is a global, linear representation of Gauquelin's results. The curve at the top plots the positions of Mars, Jupiter, Saturn, and the moon in the diurnal circle for birth times of 11,000 prominent French professionals. The bottom curve plots the distribution for birth times of 19,000 eminent professionals from Italy, Belgium, the Netherlands, and Germany.
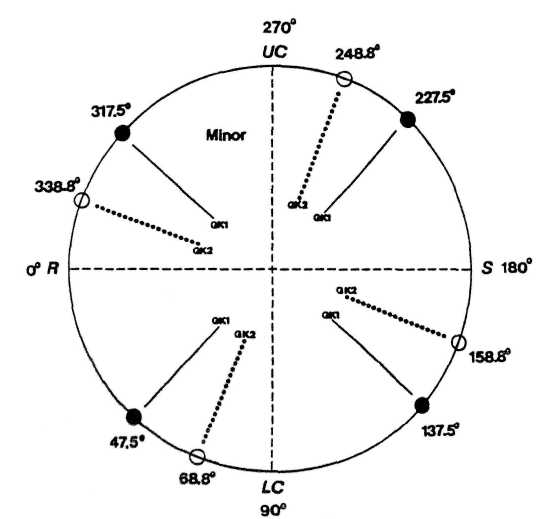
FIGURE 16. Golden-section divisions within cycles formed by the rotating earth. Sun, moon, and planets rise at R, reach upper culmination at UC, set at S, pass through the lower culmination at LC, and return to the rising point R Point R is the origin 0° of the diurnal circle of 360°. Minor golden-section points (circles) form "golden crosses" GK1 and GK2, which show a connection with the positions of the moon and planets at the birth times of outstanding professionals.
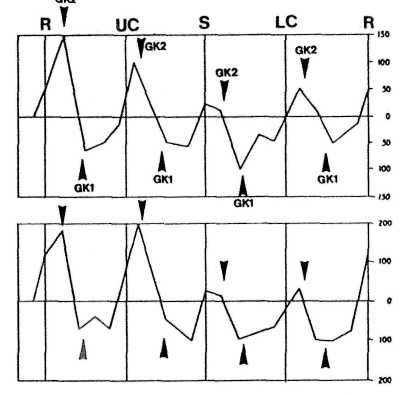
FIGURE 17 (left). Positions of the moon and special planets in the diurnal circle for birth times of eminent professionals from France (top) and from Italy, Belgium, the Netherlands, and Germany (bottom). Peaks in the distribution consistently coincide with Golden Cross GK2, the bottoms with Golden Cross GK1. After Gauquelin (1960) andAddey (1976).
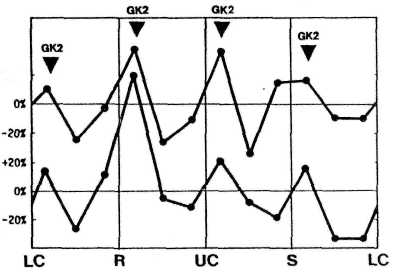
FIGURE 18 (above right) Distribution of Mars in the diurnal circle based on the birth times of famous sports champions (top) and actors and scientists (bottom) with character traits similar to those of sports champions. All peaks fall exactly at sections of Golden Cross GK2. After Gauquelin and Gauquelin (1976).
In both plots, all maxima in the directional frequency coincide with the directions in the diurnal circle indicated by Golden Cross 2 (GK2), whereas the minima concentrate on the sections of Golden Cross 1 (GK1).
The connection becomes even more precise when special planets and professional groups are isolated. In FIGURE 18, the distribution of Mars in the diurnal circle is shown. The top distribution was generated by the birth data of 2,299 sports champions. The bottom plot is related to the birth times of 4,506 scientists and actors with special biographies that stress character traits also found with successful sports champions. All maxima in both distributions fall exactly at the sections of Golden Cross 2 (GK2).
FIGURE 19 presents the distribution of Mars for a quite different vocational group: 1,345 painters at the top, 703 musicians in the middle, and 824 writers at the bottom. These are typical artists; their biographies shun character traits usually found with sports champions. There is a complete reversal in the connection with the golden section patterns. Golden Cross 1 (GK1) is now narrowly correlated with peaks in the distribution, and Golden Cross 2 (GK2) with valleys. However, the groups differ in that the musicians and writers show a connec-tj&fi with Qeldeu Cross 4 (GK4) in disgust n$m §f the diuraii circle.
Qaugu§ufl'g results were queer in I© ftr u h§ did not find any correlation for the sun, Mercury, and planets beyond Saturn, Ai the sun is by far the me§t fflfliiive body in the solar system and the dominant center of regulation, its absence in the relationship is a serious flaw. I found a remedy by extending the golden section divisions in the diurnal circle. Golden Crosses 3 and 4 (GK3 and GK4) emerge when the diurnal circle is divided as before, but using the golden section major instead of the minor (FIGURE 20). As expected, GK3 and GK4 close the gap.
Shanks (1987) made a thorough investigation of the diurnal distribution of the sun, Mercury, Uranus, Neptune, and Pluto based on the birth times of 10,464 eminent professionals from six vocational groups. He checked the expected chance distribution by 50 control groups. When I analyzed his results with respect to the golden crosses in FIGURE 20, I obtained the distribution presented in FIGURE 21. The peaks alternately conform with Golden Crosses 3 and 4 (GK3 and GK4) based on the major, whereas the minima meet the sections of Golden Cross 2 (GK2), derived from the minor.
Statistical evaluation of this distribution by the Pearson test yields %2 = 28 for 1 degree of freedom. The probability that the correlation pattern is the result of chance is less than 1 in 6 million (Landscheidt 1992).
The wealth of results from this inquiry into the function of the golden section in diverse fields of knowledge suggests the conclusion that we are dealing with a principle of Nature. Modern research corroborates this inference.
Mathematically, the golden number G is the most irrational of all irrational numbers. Consequently, it plays a central part in the KAM-theorem, developed by mathematicians Kolmogorov (1979), Arnold (1978), and Moser (1973). This theorem states that instability catastrophes in planetary systems can be prevented by planetary periods of revolution that form irrational ratios. Similarly, the physicist Greene (1979) provided proof that instability in plasma, the fourth state of matter, does not occur when quasiperiodic oscillations prevail that are governed by the golden section.
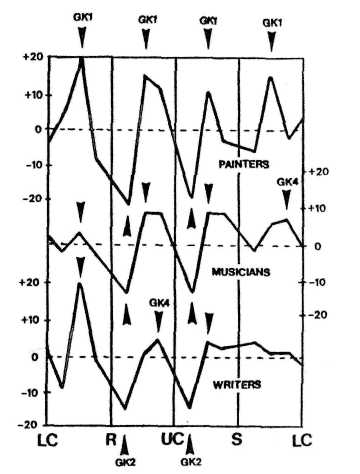
FIGURE 19. Distribution of Mars in the diurnal circle based on the birth times of painters (top), musicians (middle), and writers (bottom). All strong peaks coincide with Golden Cross GK1 and all deep bottoms with Golden Cross GK2. Two minor peaks align with Golden Cross GK4 to differentiate the professional groups. After Gauquelin (1973).
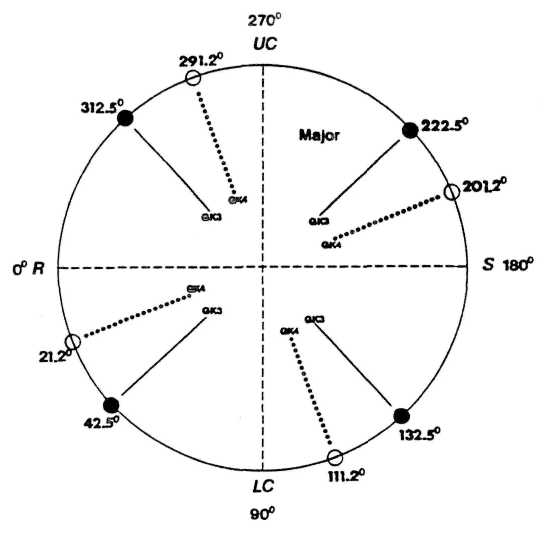
FIGURE 20. Golden-section divisions within cycles formed by the rotating earth, based on the golden section major. The resulting Golden Crosses GK3 and GK4 show correlation with positions of the sun and special planets at the birth times of prominent professionals.
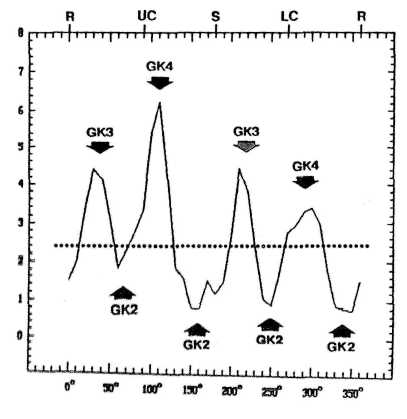
FIGURE 21. Distribution of the sun and special planets in the diurnal circle at the birth times of eminent professionals from six vocational groups. Peaks consistently coincide with Golden Crosses GK3 and GK4, troughs with Golden Cross GK2.
I hope these fundamental connections, together with the practical results, will provide a fresh perspective on this controversial topic. [cycles |
References
Published on http://bourabai.narod.ru/ according permission of Frau Christiane Landscheidt